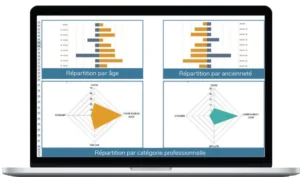
Dashboards and reporting have become essential pillars of modern businesses.
Simple, precise, and regular, they provide a clear view of activities – if they are properly set up to be genuinely actionable.
Reporting is everywhere and especially valuable for tracking the evolution of your activity. But how do you structure it to be reliable, effective, and quick to produce?
Reporting is a synthesis of quantitative and qualitative data, gathering dashboards, KPIs, and performance indicators shared as trends to monitor strategy, understand activities, and analyze performance. Tools like Inside and Power BI enable you to structure this data in a simple and actionable way.
What Exactly is the Purpose of Reporting?
Reporting serves four main objectives:
• Guide strategic decisions with precise analysis
• Direct teams toward goals set by managers
• Add meaning to work through performance tracking
• Offer transparent views of indicators across the organization
Solutions like Inside Reporting make adopting reporting easier by making it accessible and coherent, integrated with tools like Excel for immediate access to data.
Which Type of Reporting Suits My Needs?
To better structure your strategy, different types of reporting can help guide your thinking and support your analysis.
• Strategic reporting: Used in executive committees, it provides an overview of company performance. Key indicators cover overall activity to support strategic decision-making.
• Project reporting: Using an agile approach, this reporting tracks project progress and performance. It facilitates collaboration among stakeholders and provides a clear view of project status, often using tools like Power BI for visual indicators.
• Analytical reporting: This precise dashboard enables a detailed analysis of an activity or service. Solutions like Inside Reporting help compile large volumes of data for an in-depth analysis of pre-defined indicators.
• Operational reporting: It addresses the specific needs of different departments (finance, sales, marketing, HR, etc.), offering an overview of progress and strategy. Adaptable and actionable, it allows for daily adjustments.
These reports allow for the customization of indicators and KPIs aligned with your activity’s needs. With solutions like Inside and Power BI, you can automate data compilation and produce real-time dashboards, making your analyses smoother and your operations more efficient.
How to Build Effective Reporting?
Reporting generally involves three key steps:
• Identify needs: Define the information to be tracked, and aligned with your company’s strategy. Use the SMART method for precise indicators: Specific, Measurable, Achievable, Relevant, Time-based.
• Data processing: Data may come from manual entry or business tools. Ensure data reliability, relevance of data volumes, and uniform formats to ease comparisons, and apply calculations if needed to make data actionable.
• Dashboard creation: Reporting should be actionable. Choose effective graphical representations, and measurable data, and maintain overall coherence. With tools like Inside or Power BI, KPI tracking can evolve with your needs, providing a solution that stays relevant.
With these guidelines, reporting should no longer be a mystery! With Inside and Power BI, you have the tools to create reliable and optimized reports, allowing your organization to make informed decisions. It’s time to take action!


