CES 2027 · Las Vegas · Eureka Park, booth 60601 · January 6–9 — meet the AI analystBook a meeting at the booth →
FeaturesAI analystSecurityCES 2027 Book a demo English · Français and Español soon
New · Ten analysts. Eleven languages. CES 2027

Your numbers, explained out loud.

Premium IBCS dashboards with an AI analyst who answers out loud, in your language, and proves every figure.

Book a demo
  • Unlimited users
  • No Power BI or Zebra BI license
  • Refreshed every day
  • Desktop, tablet and mobile
JackAI analyst

October 2026 · Elvane, all sites

“October closed at €412k, up 3.2 % on last year.”

Ask your analyst:

Illustrative data — Elvane, a fictional company.

Trusted by 40 companies in Europe and the Caribbean — 12+ run Executive Intelligence in production.

3views of every figure: Analysis, Financial, Stats
10AI analysts, five women and five men
11languages, with a local first name in each
HoverTap any dotted figure.Formula, source, period and scope: every number here shows its proof, as in the product.
The problem

The dashboard is ready.
The answer is not.

  1. Your dashboard refreshes in seconds.The explanation still takes two weeks.
  2. Figures get debated.Nobody in the room can see where they come from.
  3. The story lives in one person’s head.And in one language.

Put the analysis on the page, not on the agenda.

The product

One figure. Three views.

Analysis, Financial, Stats — all in IBCS, the international standard for business charts. One click switches the view; your period and scope stay put.

The story behind the figure.

What happened, how to read it, what to ask next.

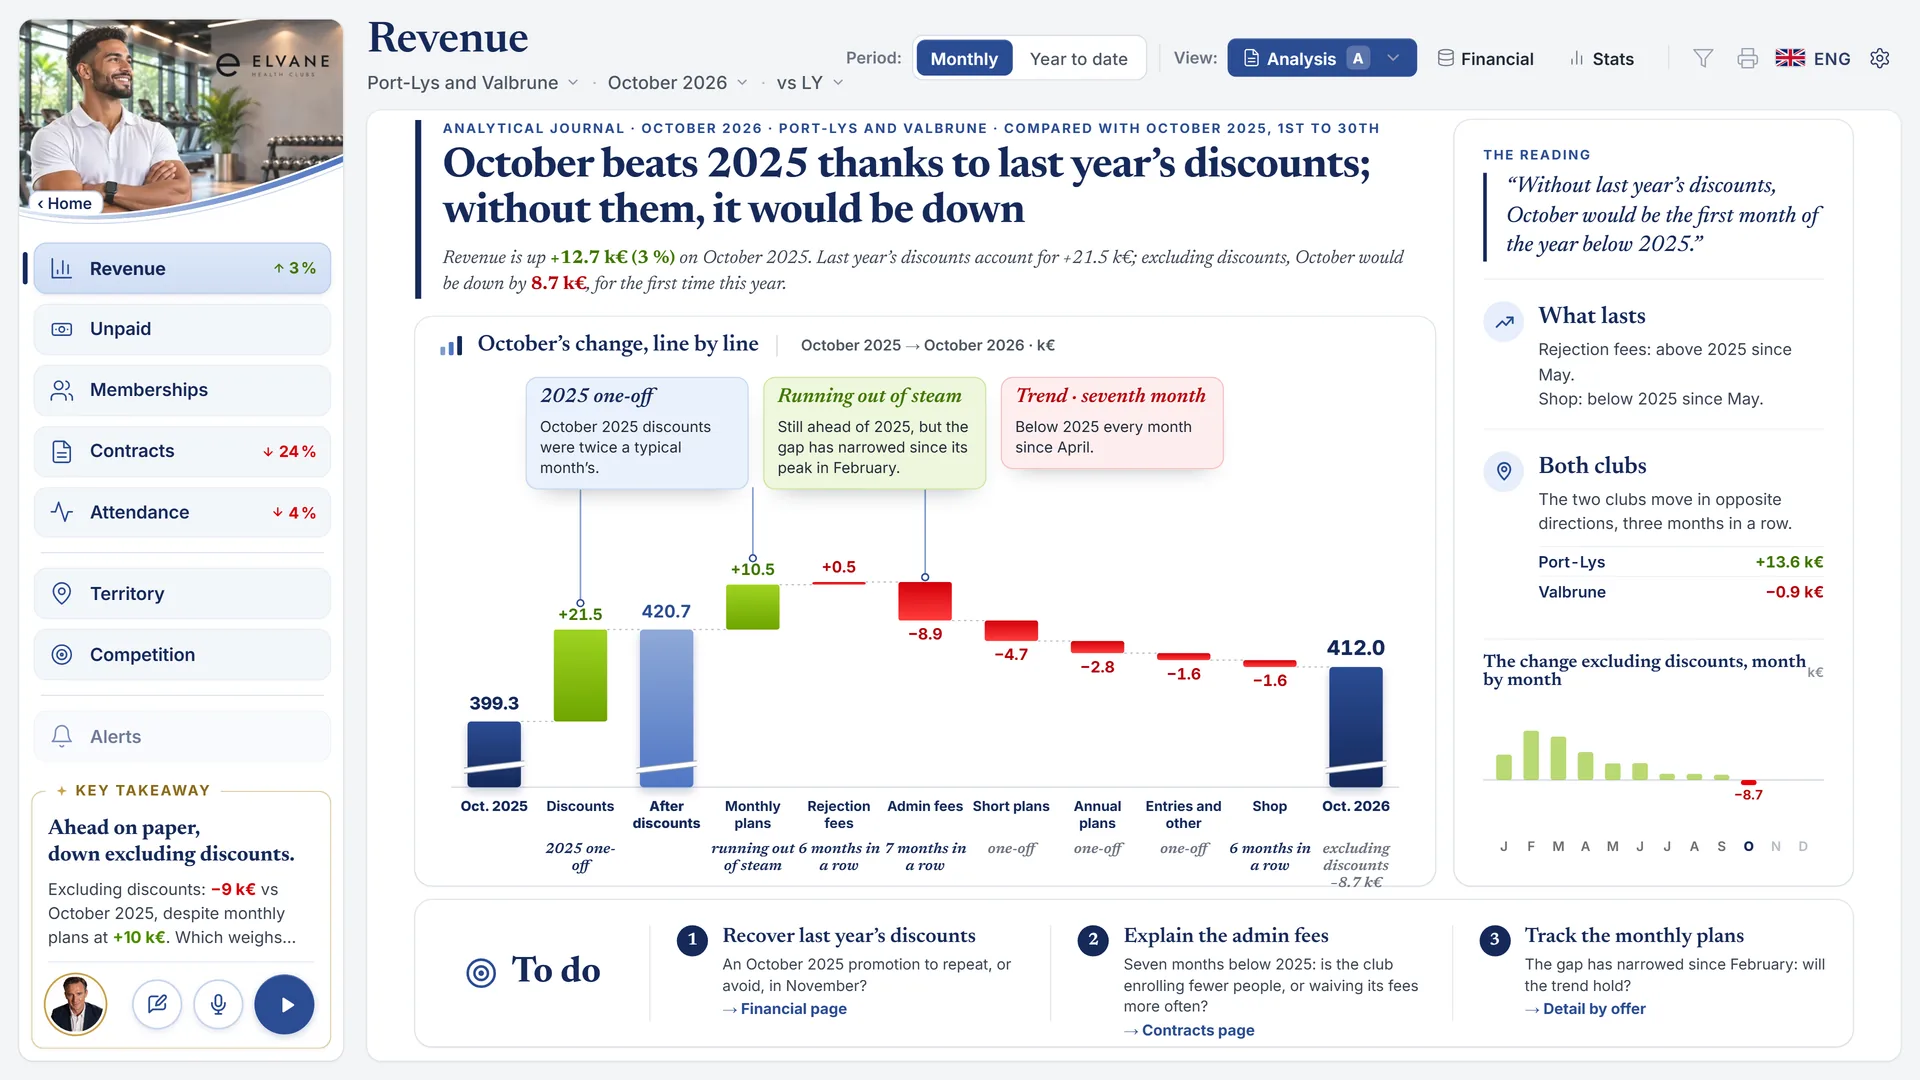
  • Bridge from last year, line by line
  • Finding, reading, open question
  • Three actions, each linked to its page
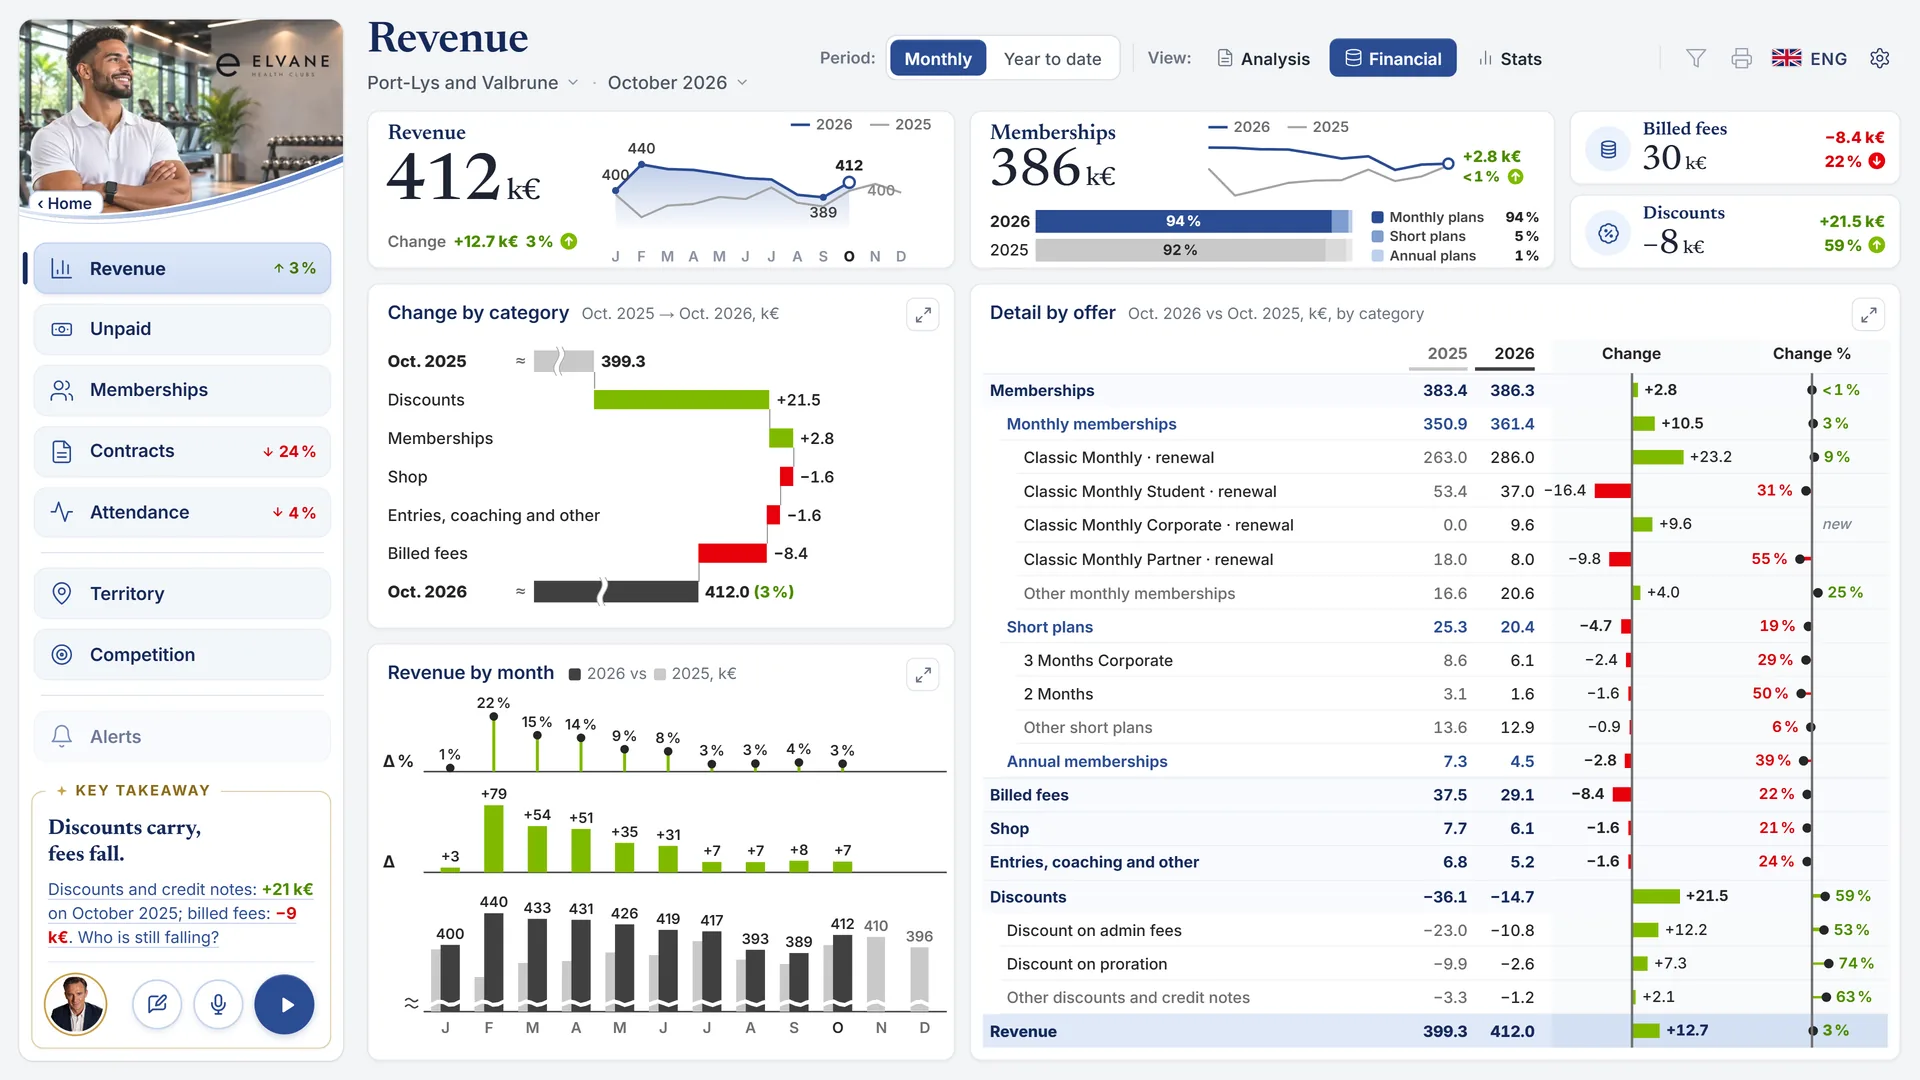
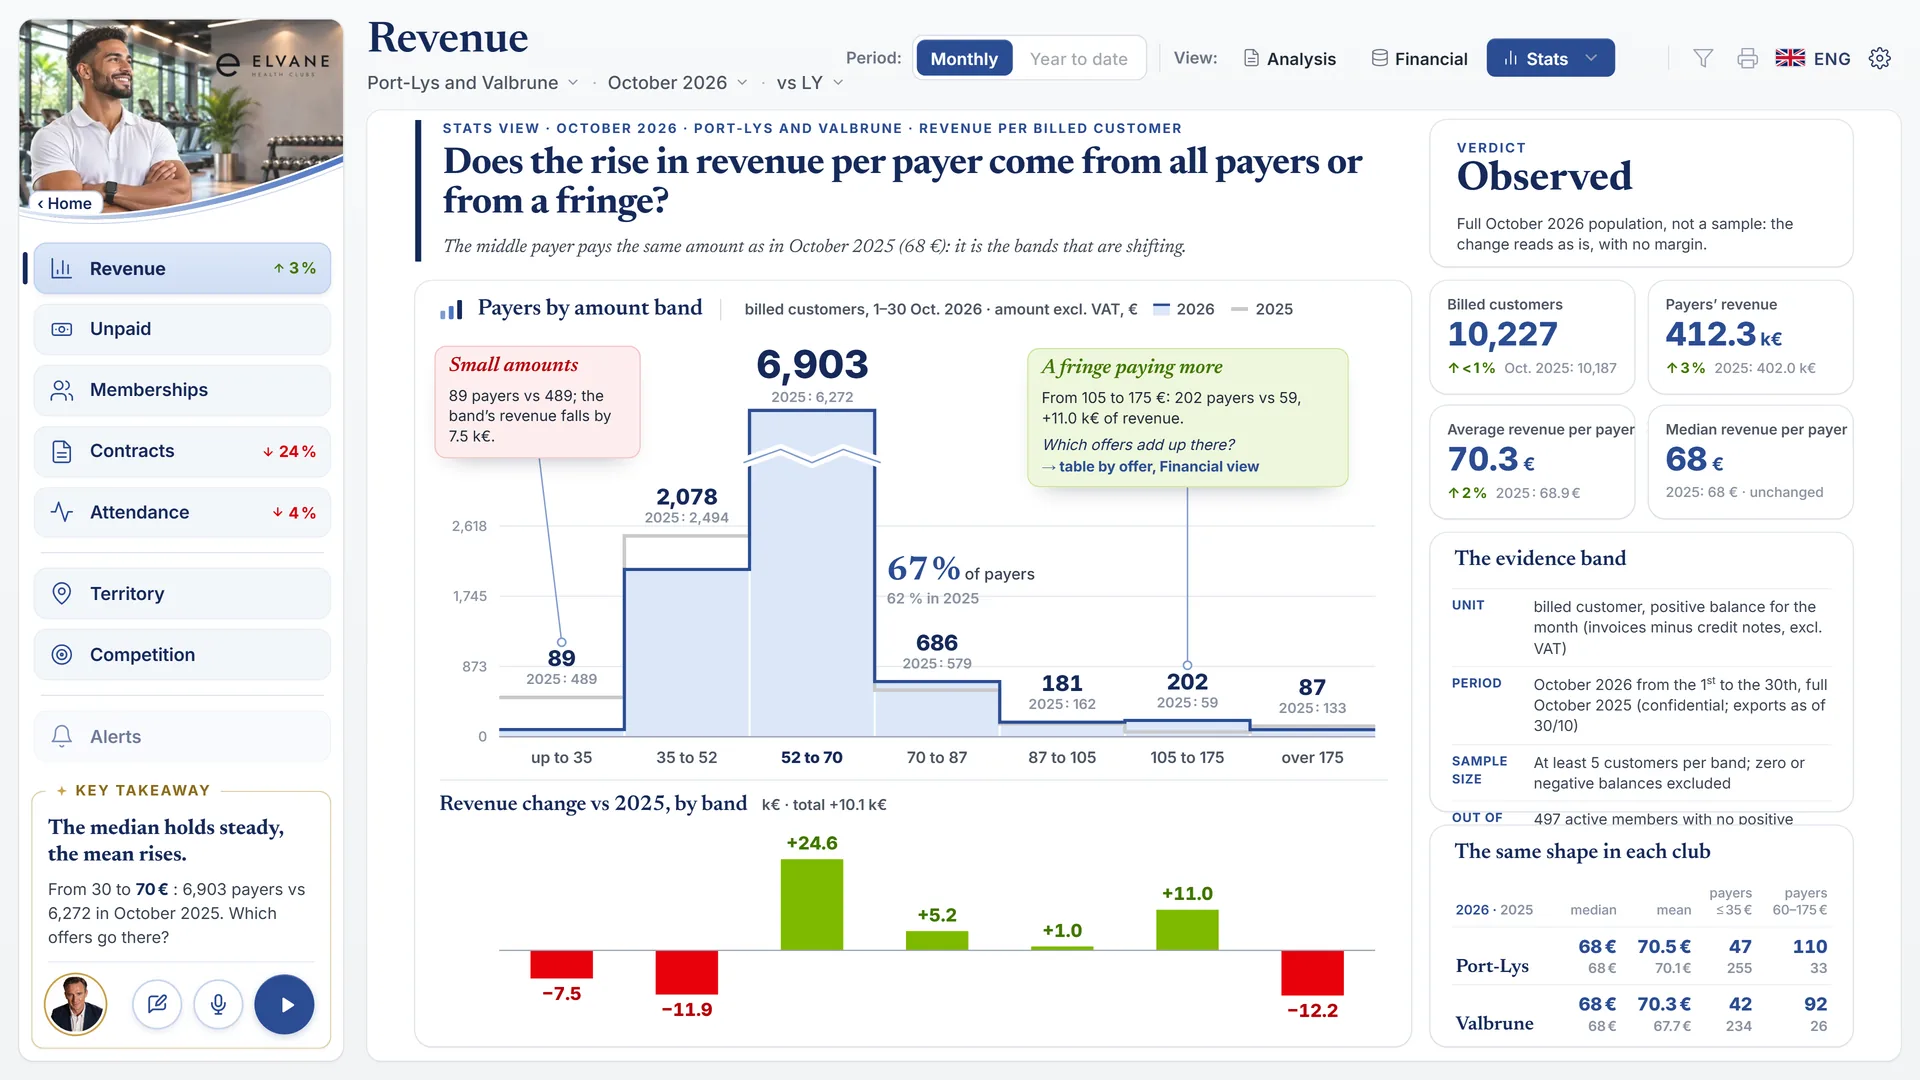
Analysis view of the Revenue page: a bridge from October 2025 to October 2026, line by line, with the analyst’s reading Financial view of the Revenue page: KPI cards, twelve months against last year and the variance table Stats view of the Revenue page: who is behind the figure, by amount band
Illustrative data — Elvane, a fictional company.
SayEvery title is the message, with its figure.
UnifyActual, last year and plan look the same everywhere.
CondenseTwelve months, KPIs and the analysis on one screen.
CheckEvery figure carries its proof. A variance is never cut.
The AI analyst

Choose your analyst.

Ten faces, eleven languages. Hover to meet them, click to hear them.Tap a face to hear them.

Pick a language — the names change:English
Meet the AI analyst →
The product, in six steps

Everything. In every plan.

The full product in every plan. Plans differ by size and service.

01 / 06 · Narrated review

Press play. Get briefed.

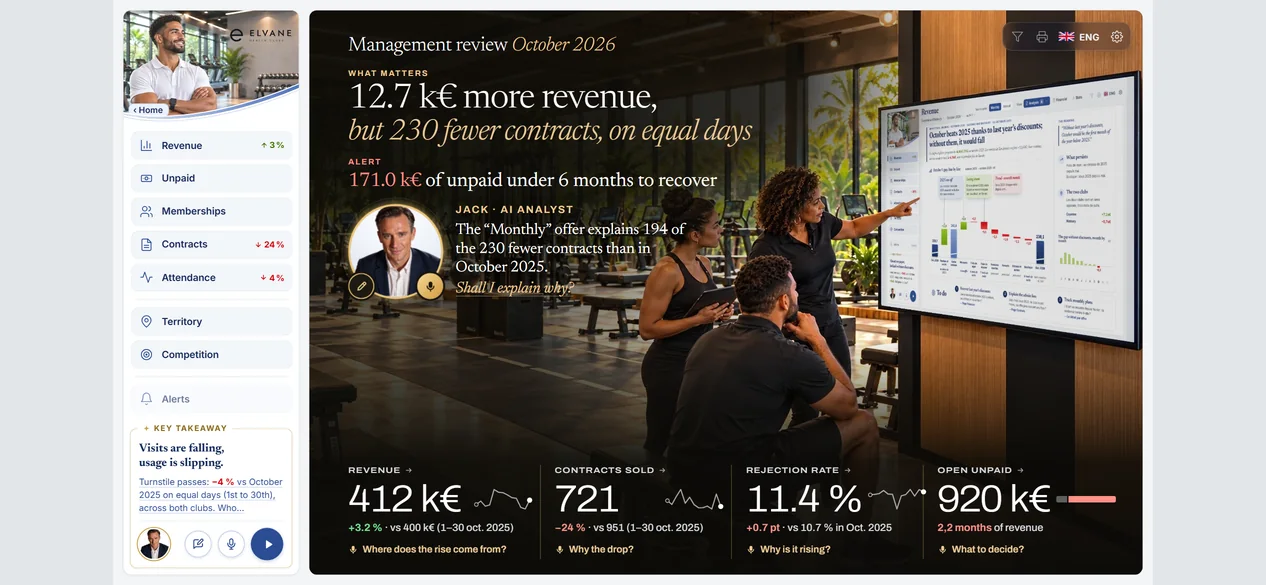
Your analyst takes over the screen, with subtitles, and lights up each figure it names.

  • Highlights what it names
  • Subtitles on every sentence
  • Pause or interrupt at any time
02 / 06 · Conversation

Ask out loud, in the meeting.

“Where does the revenue gap form?” The analyst answers aloud, puts the chart on screen and suggests the next question.

  • Written or spoken
  • Eleven languages
  • Interrupt, change the subject, carry on
03 / 06 · Whiteboard

One idea. One drawing.

When an explanation needs a picture, the analyst draws it on a whiteboard while it speaks.

  • Built from your own figures
  • One idea per board
  • Explained aloud as it is drawn
04 / 06 · Eleven languages

Speaks your language. Literally.

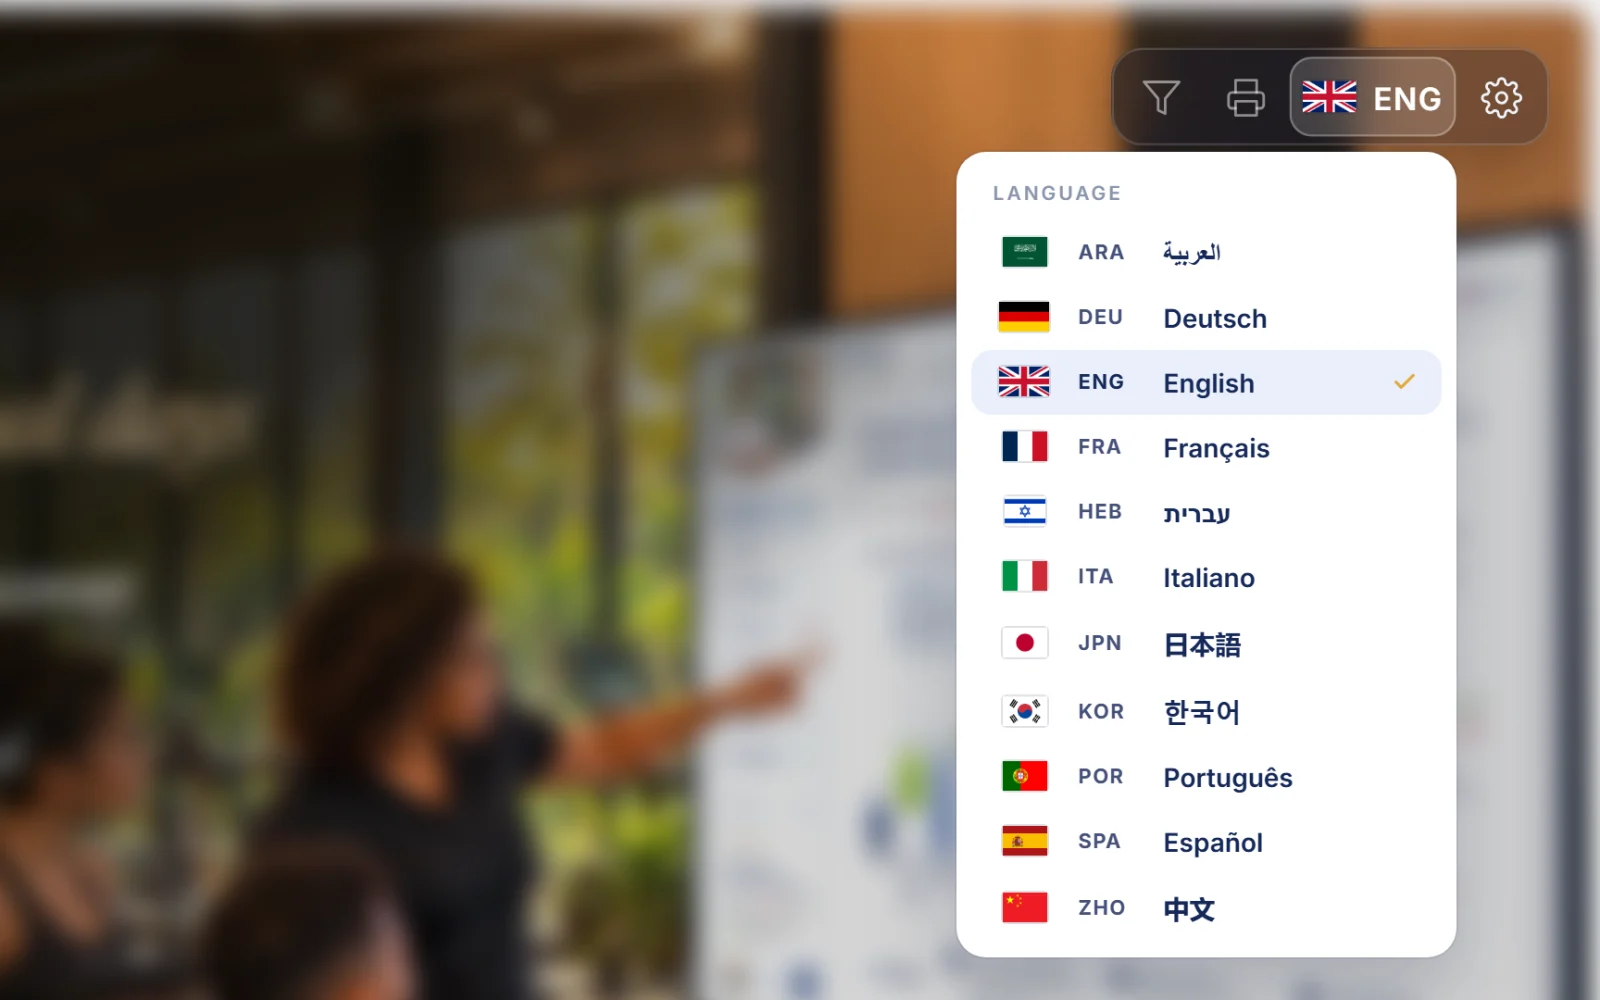
Pick a flag: the voice, the first name and the screen follow.

  • Eleven languages
  • A local first name in each
  • The same figures, the same proof
05 / 06 · Proof of a figure

Every figure shows its proof.

Hover overTap any number: formula, source, period and scope. Your rules are applied the same way on every page and in every answer.

  • Formula, source, period, scope
  • Your rules, the same everywhere
  • The engine calculates; the analyst explains
06 / 06 · Word and Excel

Leave the meeting with Word and Excel.

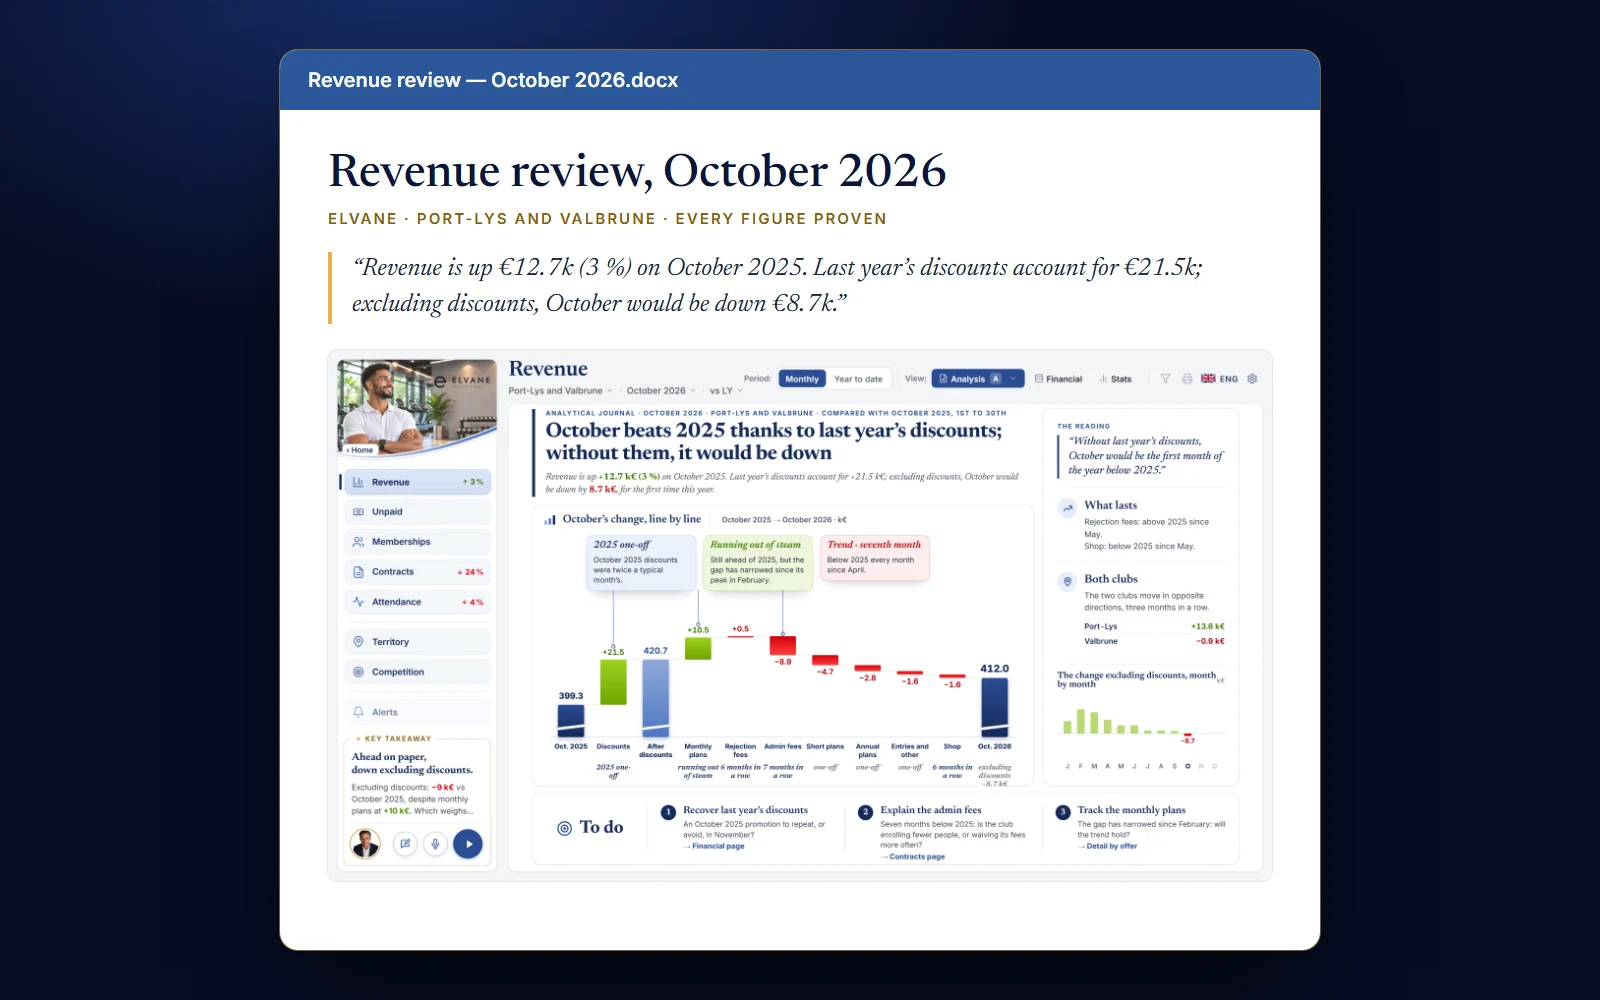
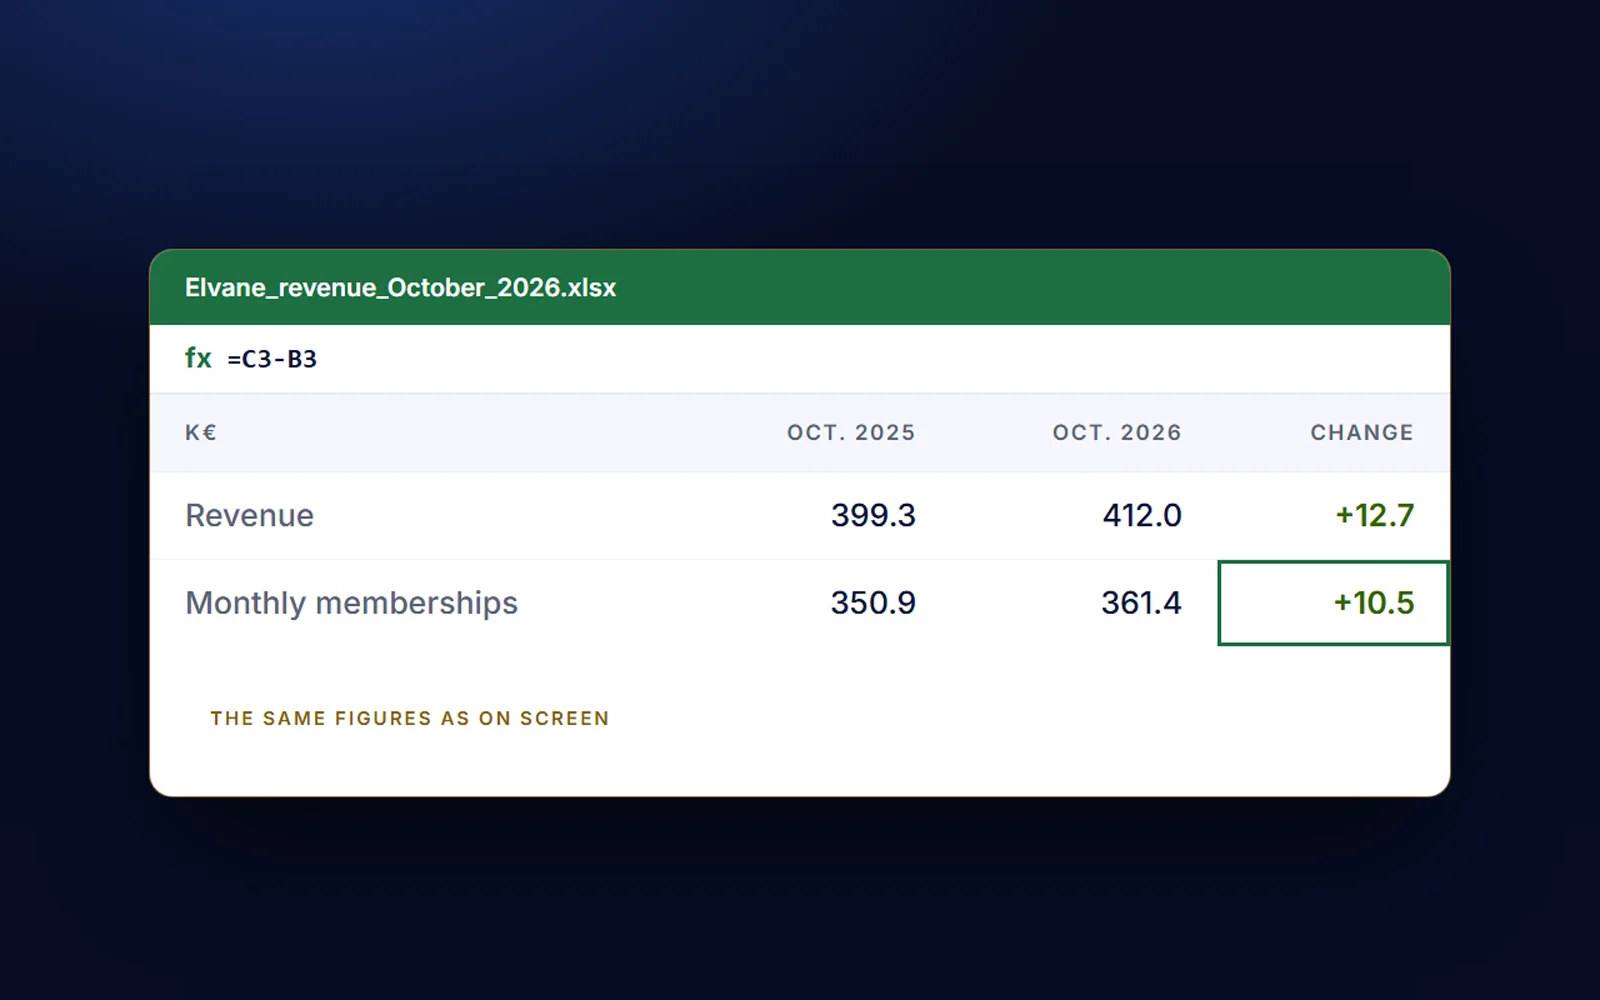
Export the conversation as a Word report with the analyst’s charts, and the figures as an Excel workbook with live formulas.

  • A Word report ready to circulate
  • Variances are formulas, not pasted values
  • The same figures as on screen
See all features →

Alerts, automated reports and mobile

Automated reports

Reports that send themselves.

Schedule PDF or Word packs and the review by email. Each reader receives it on the morning you choose.

  • Scheduled PDF and Word packs
  • The review by email
  • A morning review, every day
Mobile

The same analyst, in your pocket.

Every page, every view and the analyst on desktop, tablet and phone. On a phone held sideways you see the whole dashboard.

The management review on a phone held sideways: the whole dashboard, nothing cut
A team in a meeting room looks at the dashboard on the wall screen while the analyst presents
Meeting-room mode

Made for the boardroom.

Your analyst presents. The table asks out loud. The answer goes up on the wall.

  • Read from the back of the room
  • Questions from any seat, answered aloud
  • The chart already on the wall
Trust & Security

Proven figures. Protected names.

Your analyst explains. It never invents a figure: each one is calculated from your data.

Try it · Revenue, October 2026€412.0k

HoverTap the figure. Every number in the product answers the same four questions.

Illustrative data — Elvane, a fictional company.

Read Trust & Security →
Proof behind every figureFormula, source, period and scope, one hovertap away.
Names anonymizedBefore any exchange with the AI model; restored on your screen.
Your rules, everywhereOne definition per indicator, on every page, answer and export.
Never used to train a modelThe language model is used under terms that exclude training on your data.
Deterministic figuresEvery figure is calculated by the DataVizX engine, never by the AI model.
Named lists stay with your usersThe dashboards show aggregated figures. Named lists are visible only to your own users, never to the AI model.
Statistical confidentialityNo count from one to four is published by place of residence, directly or by subtraction.
Hosted in EuropeThe product is hosted in Europe. Dedicated hosting or your own servers, and single sign-on, on the Group plan.
Connectors

Works with the software you already run.

No migration and no new BI license. We connect to your sources, apply your rules and refresh every day.

ResamaniaSagePower BI datasetsSQL ServerExcel & CSVYour ERPBusiness applications
ConnectYour management software, your accounting, your files.
Set your rulesYour indicators, your definitions, your thresholds — proven on your own figures.
Read, ask, shareOn screen, out loud, by email, in Word and Excel.

Set-up is free when we already connect to your software.

Questions

Asked in every demo.

Do we need Power BI or Zebra BI licenses?

No. The subscription covers the dashboards, the AI analyst, exports and automation. Your readers need no other license.

What are the Analysis, Financial and Stats views?

Three views of every indicator in IBCS notation: what happened and why; KPIs, twelve months against last year and the variances; who is behind the figure and how far a comparison can be trusted.

Can the AI invent a figure?

No. Every figure is calculated by the DataVizX engine from your data and your rules, with its proof. The analyst explains; it never calculates.

Does the AI model see the names in our data?

No. Names are anonymized by DataVizX technology before any exchange with the AI model, and restored on your screen.

Which languages does the analyst speak?

Eleven: Arabic, Chinese, English, French, German, Hebrew, Italian, Japanese, Korean, Portuguese and Spanish.

What is the difference between the plans?

The product is the same. Plans differ by indicator pages, sources, sites, speaking hours and service level; the Group plan adds consolidation, dedicated hosting and single sign-on.

Is set-up charged?

Not when we already connect to your software.

Book a demo

Bring one question.

We’ll answer it live, out loud, on dashboards built like yours.