In a world overflowing with numbers, charts, and reports, the challenge isn’t gathering data—it’s making sense of it quickly and accurately. Zebra BI, an advanced data visualization add-in for Excel and Power BI, is designed to do exactly that. By combining powerful automation with best-practice visual standards, it transforms raw data into clear, actionable business stories that anyone can understand.
This article explores why Zebra BI matters, how it benefits a variety of roles, and best practices for making the most of it.
Why Zebra BI Matters
Traditional reporting tools often produce cluttered charts, inconsistent visuals, and confusing layouts. This makes it harder for decision-makers to grasp trends, spot exceptions, and act on insights. Zebra BI changes that by:
- Applying International Business Communication Standards (IBCS) for consistent, easy-to-read visuals.
- Automating repetitive tasks like chart formatting and table design.
- Enabling storytelling with data, so reports are not only informative but persuasive.
The result? Reports that speak for themselves, whether you’re in finance, sales, operations, or management.
Key Advantages Across Professions
1. IBCS-Compliant Visuals
Zebra BI automatically formats charts and tables according to the IBCS framework—ensuring visual clarity and consistency across all reports. This reduces interpretation errors and speeds up decision-making.
Example:
- A CFO instantly distinguishes between actuals, forecasts, and budgets thanks to standardized color and shape coding.
- Sales leaders see trends without the distraction of inconsistent visuals.
2. True One-Click Automation
Instead of spending hours adjusting layouts, Zebra BI lets you:
- Switch chart types instantly without breaking formatting.
- Add variance charts and growth indicators with one click.
- Refresh all visuals automatically when data changes.
This frees up time for analysis over formatting, boosting productivity for both analysts and managers.
3. Seamless Integration with Excel and Power BI
Whether you work directly in Excel or create interactive dashboards in Power BI, Zebra BI fits into your workflow:
- In Excel: build executive-ready reports in minutes.
- In Power BI: add interactive visuals that follow corporate design standards.
- No need for additional software—just extend your existing tools.
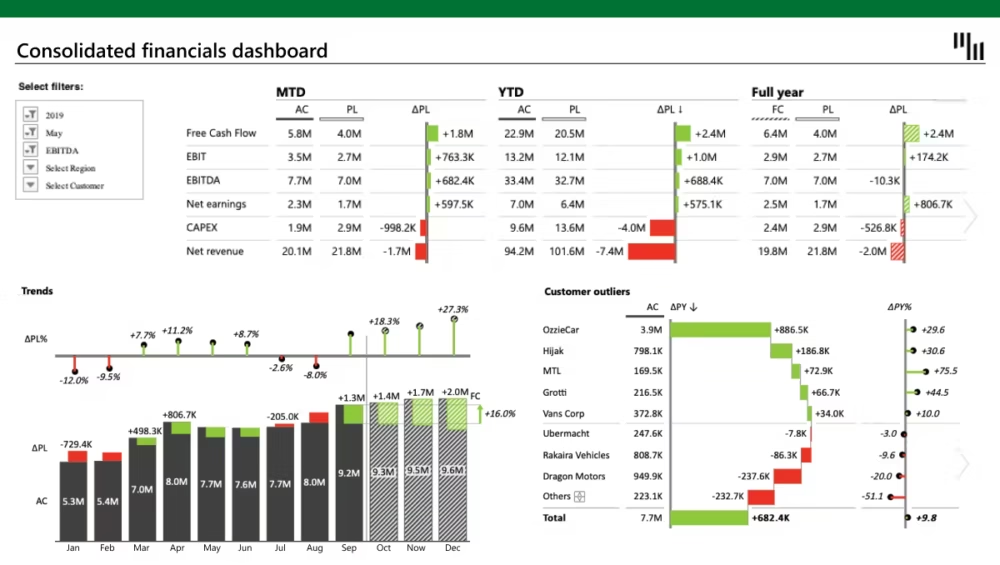
4. Advanced Variance and Contribution Analysis
Understanding “why” performance changes is often harder than tracking “what” happened. Zebra BI’s variance charts and waterfall visuals make it easy to:
- See absolute vs. relative changes.
- Identify the biggest positive or negative contributors.
- Spot exceptions without combing through raw tables.
5. Storytelling with Data
Zebra BI’s report pages are designed to guide the reader through the narrative:
- Highlight the most important findings.
- Show cause-and-effect relationships.
- Link visuals logically, so readers follow the same thought process as the analyst.
When Zebra BI Shines Most
Choose Zebra BI when:
- You need to present data to non-technical audiences and want instant comprehension.
- You produce recurring reports that must remain consistent and on-brand.
- You want to accelerate report production without sacrificing quality.
- Your role involves explaining performance changes, not just showing results.
Summary Table: Zebra BI Benefits by Role
| Role / Department | Key Benefits |
|---|---|
| Finance | Variance analysis, budget vs. actuals, IBCS compliance |
| Sales & Marketing | Growth trends, regional performance comparisons |
| Operations | KPI tracking, process efficiency visuals |
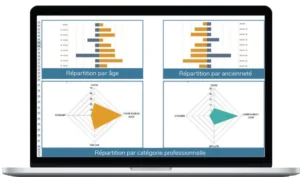
| HR | Headcount trends, turnover analysis, cost tracking |
| Executive Leadership | Strategic storytelling dashboards, unified corporate design |
Best Practices for Getting the Most Out of Zebra BI
- Adopt IBCS standards across the organization for maximum clarity.
- Use templates for recurring reports to ensure speed and consistency.
- Leverage variance and waterfall charts to explain changes, not just show results.
- Integrate with Power BI dashboards for interactive storytelling.
- Educate stakeholders on interpreting visuals—clear charts are even more powerful when audiences understand their design.
Final Thoughts
Zebra BI bridges the gap between data analysis and data storytelling. By automating formatting, applying proven communication standards, and enhancing both Excel and Power BI, it helps organizations of any size and industry turn complex data into clear, actionable insights.
The takeaway is simple:
- For clarity, Zebra BI enforces consistency.
- For speed, it automates time-consuming tasks.
- For impact, it turns numbers into stories people remember—and act on.