It never calculates a figure.
Every figure is calculated by the DataVizX engine from your data and your rules. The analyst explains; the engine calculates.
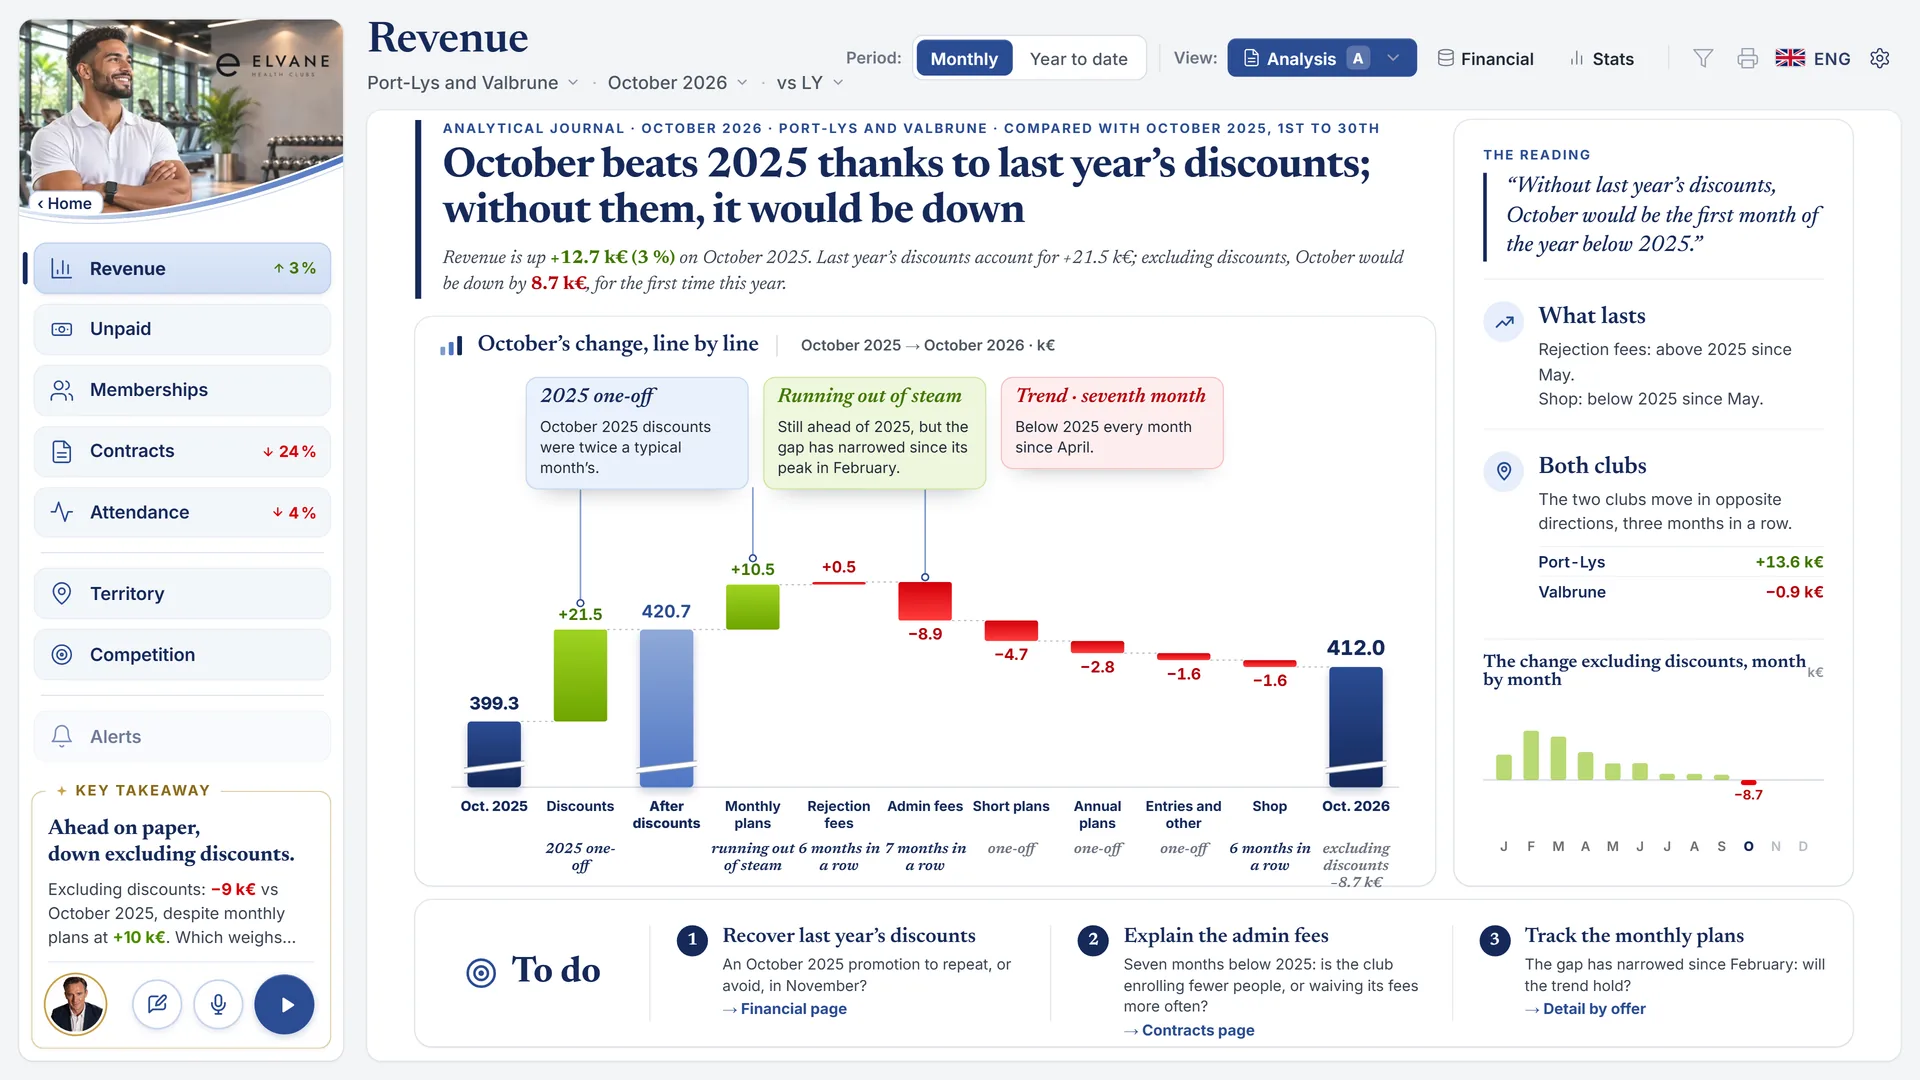
More than a text box under a chart: a member of the meeting. It answers out loud, puts the right chart on screen and shows the proof of every figure it quotes.
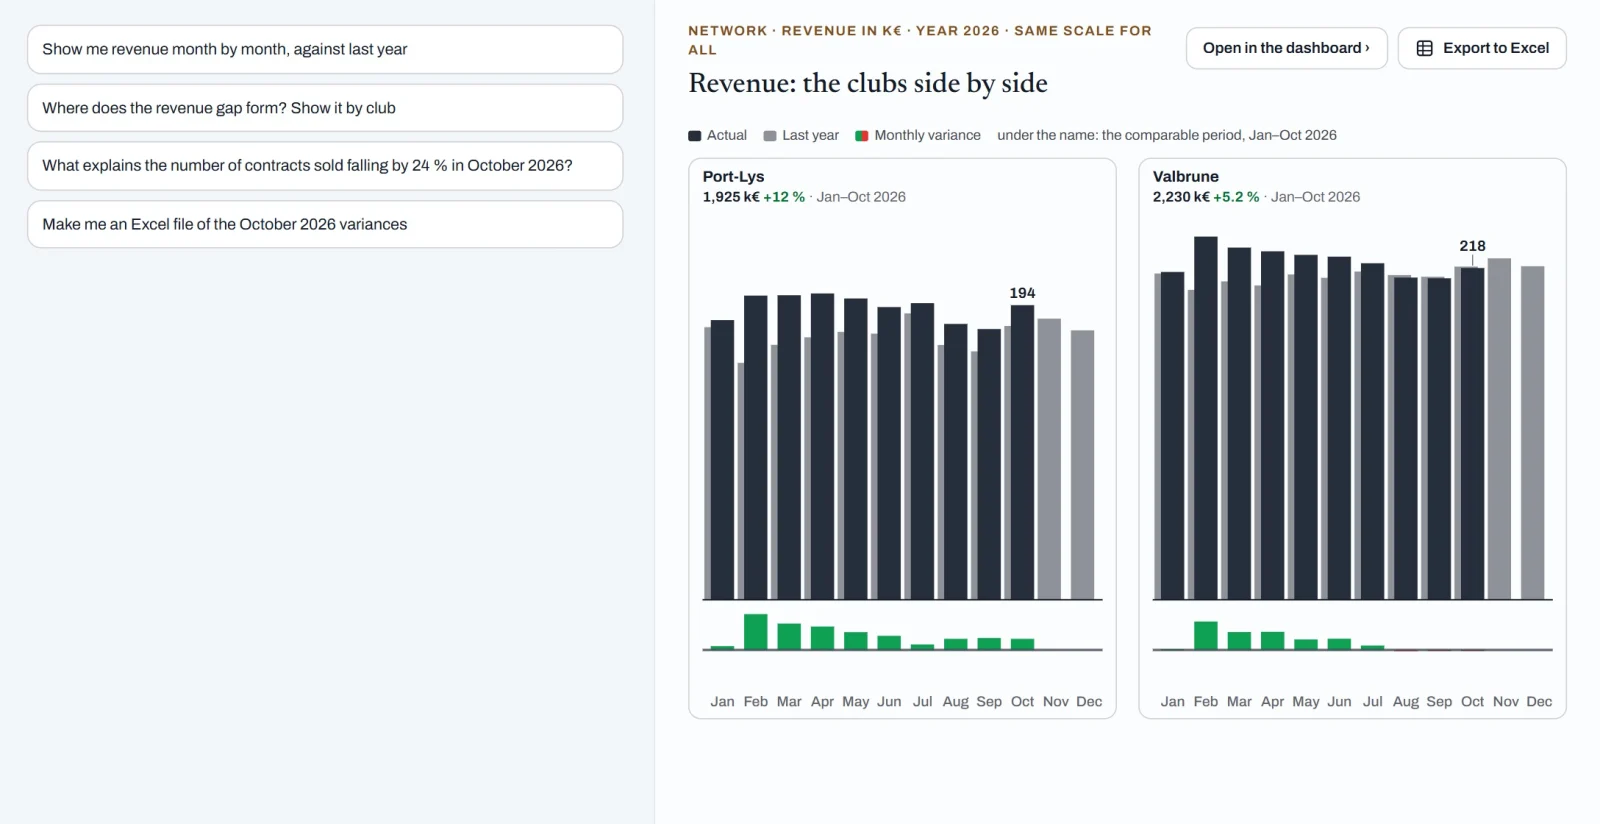
Type your question, or say it out loud. The analyst tells you what it is looking at, answers in a few sentences, shows the chart and suggests one next question. Interrupt it whenever you like.
Five men and five women. Same analysis, same figures, same proof: you choose the face and the voice your team prefers, and change at any time in the settings. Hover to meet them, click to hear them.Tap a face to hear them.
Prefer a familiar face? Your own avatar — your digital twin — is included in Group and optional in Club and Network.
Press play on any page. The analyst takes over the screen, walks you through what it shows and highlights each element as it names it.
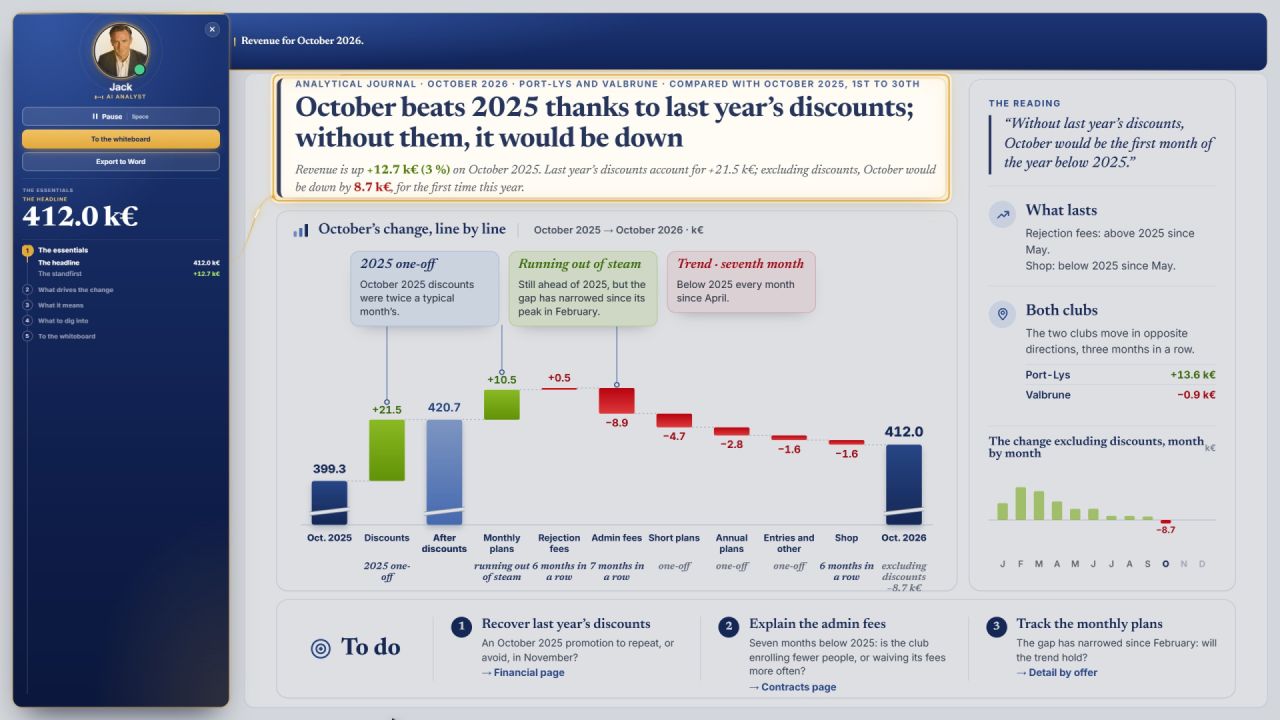
Pick a language in the top bar of the dashboard: the voice, the first name and the screen follow. The figures do not change.
One analyst, eleven first names.
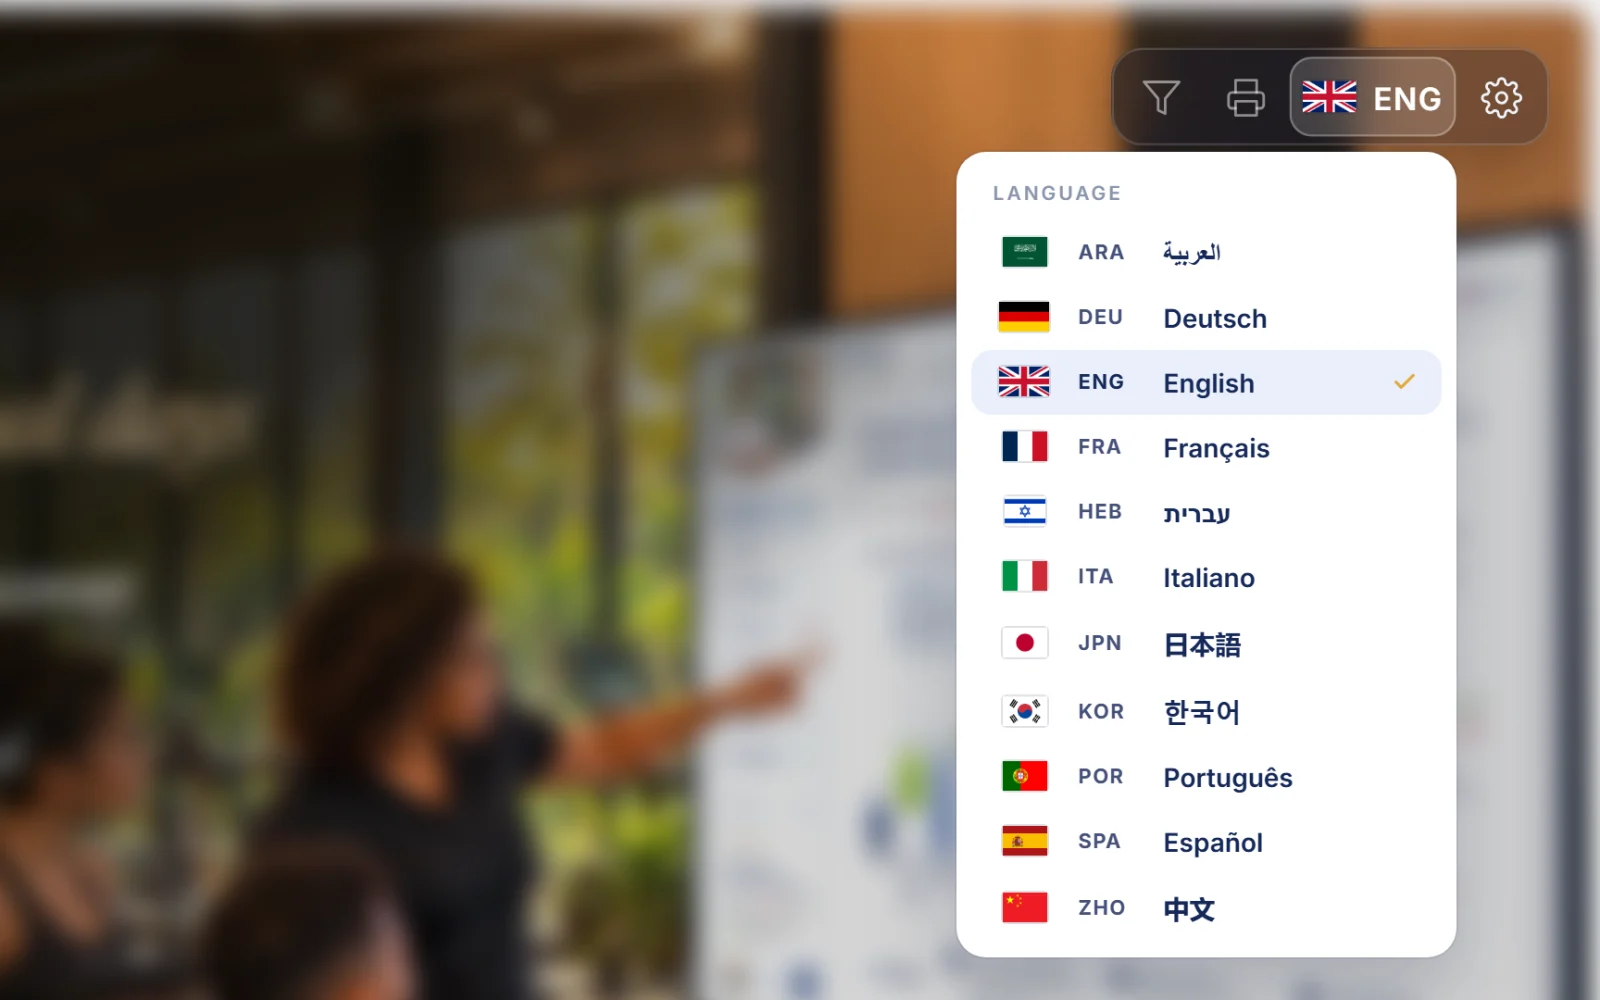

On the large screen of the meeting room, the analyst presents the review to the whole table. When an idea needs a picture, it opens a whiteboard and draws one idea while it explains.
Every figure is calculated by the DataVizX engine from your data and your rules. The analyst explains; the engine calculates.
Formula, source, period and scope, for every number it names, on screen and in every answer.
Names are anonymized before any exchange with the AI model and restored on your screen. The language model is used under terms that exclude training on your data.
How your names stay protected →Always there, never in the way. The dashboards are complete on their own. The analyst is there when you call it, and quiet when you do not.
Bring one question. We’ll answer it live, out loud, on dashboards built like yours.