Dashboards in IBCS notation (International Business Communication Standards), an AI analyst who narrates your financial review, automation, exports and security. One subscription, unlimited users, no BI license.
Every plan includes all twelve. Plans differ by size and service.
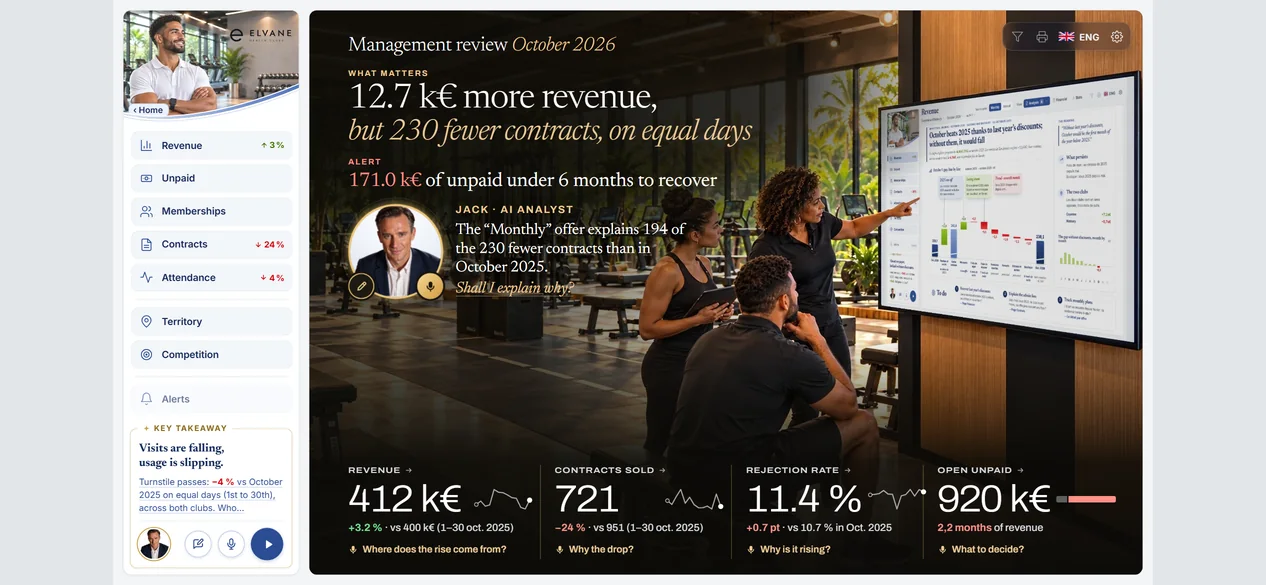
01 / 12 · Management review
The month, on one screen.
The home page opens full screen on the management review of the month: the headline, the figures behind it, the points that need a decision.
Refreshed every day
Headline first, figures second
One click to the page behind each line
Illustrative data — Elvane, a fictional company.
02 / 12 · Analysis
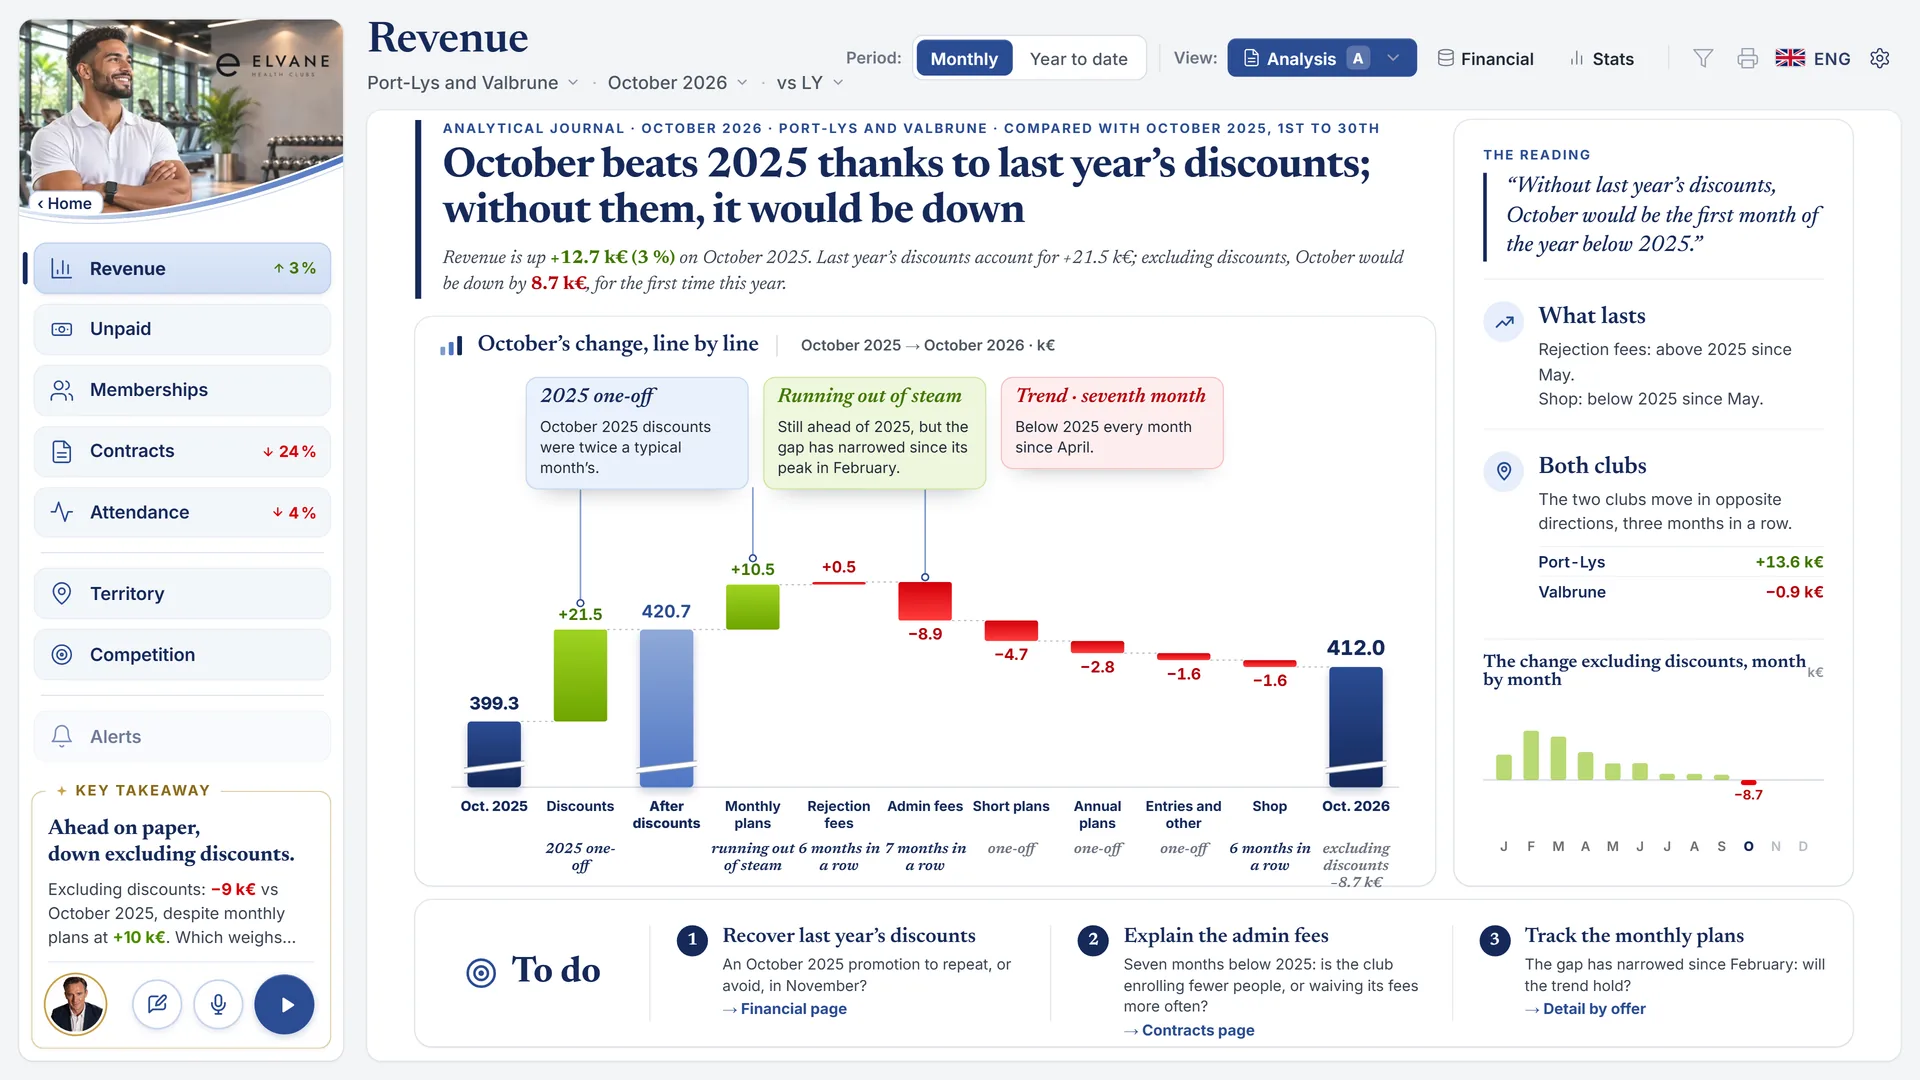
An analysis you read like a journal.
The Analysis view tells what happened behind the figure: the finding, how to read it, the question to investigate — written into the charts, not boxed beside them.
Finding, reading, open question
Notes attached to the chart they explain
A bridge from last year, line by line
Illustrative data — Elvane, a fictional company.
03 / 12 · Financial
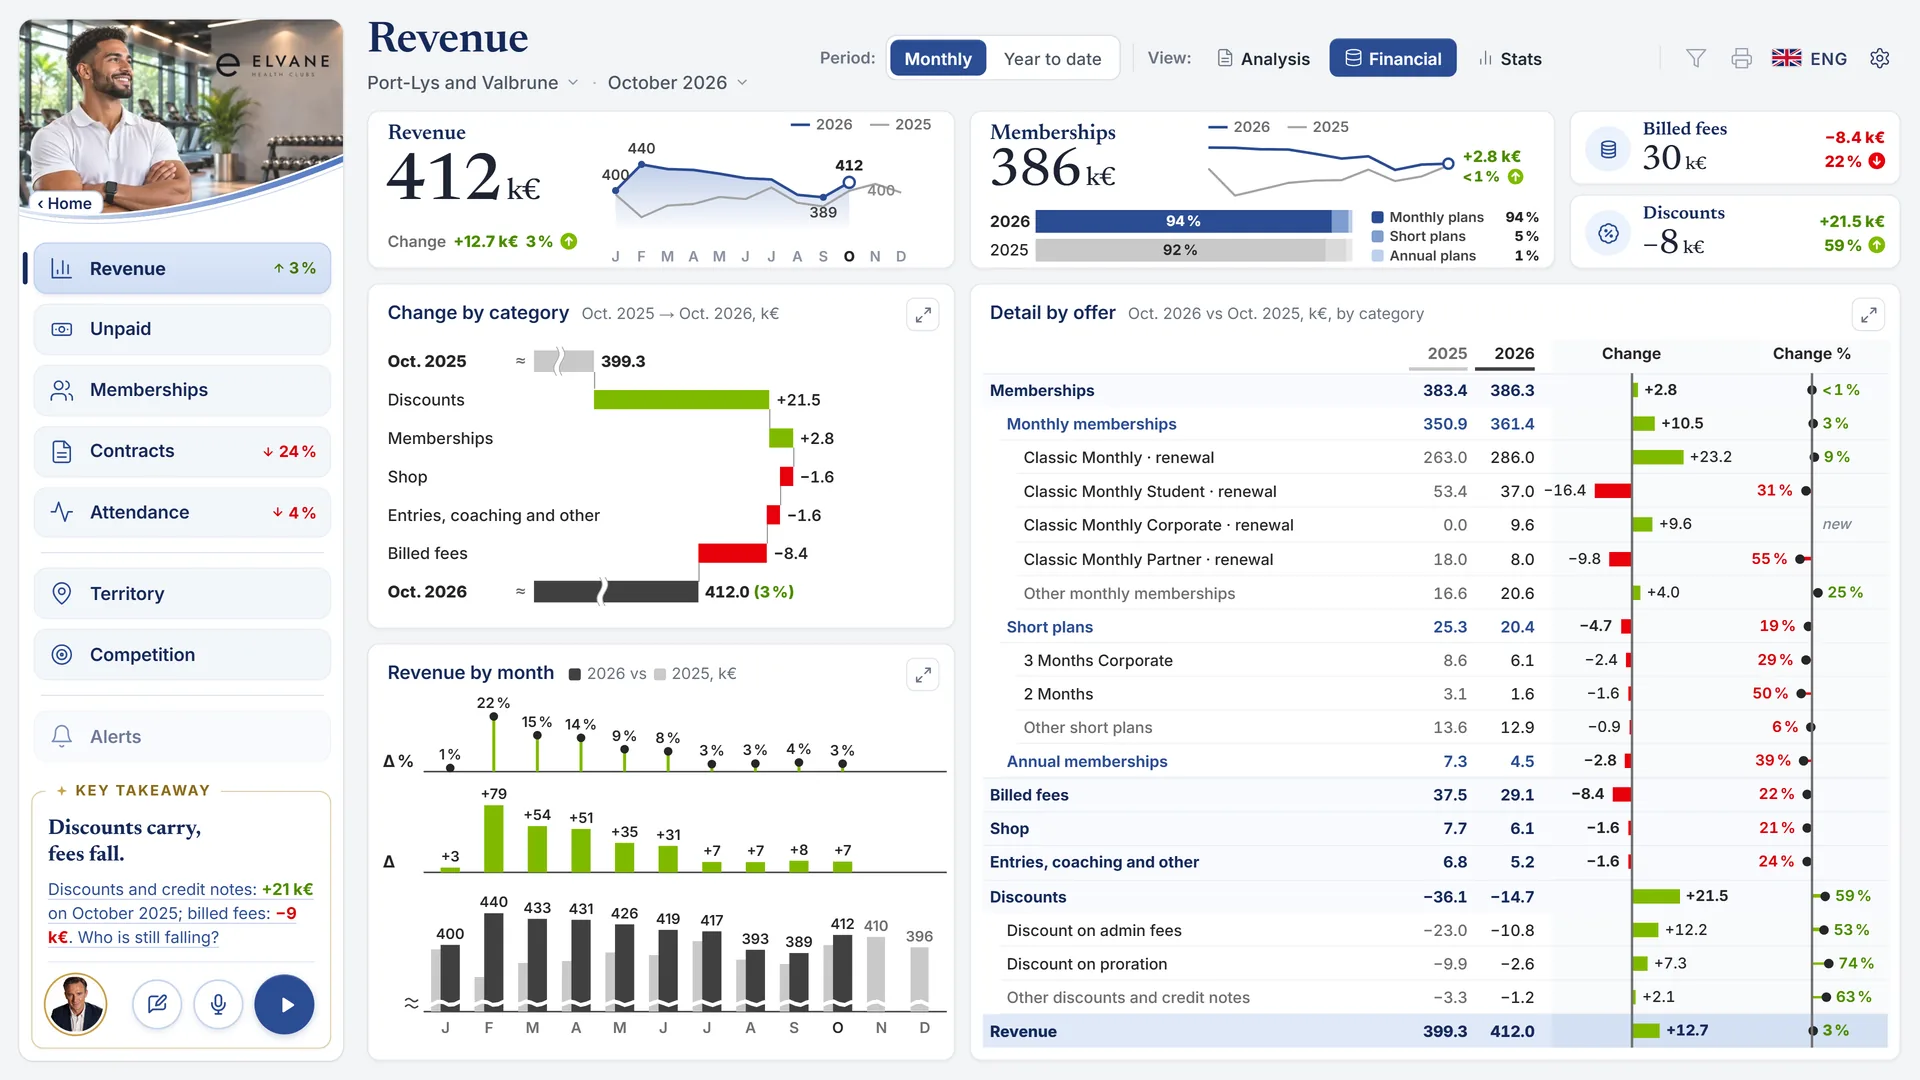
Financial pages in IBCS notation.
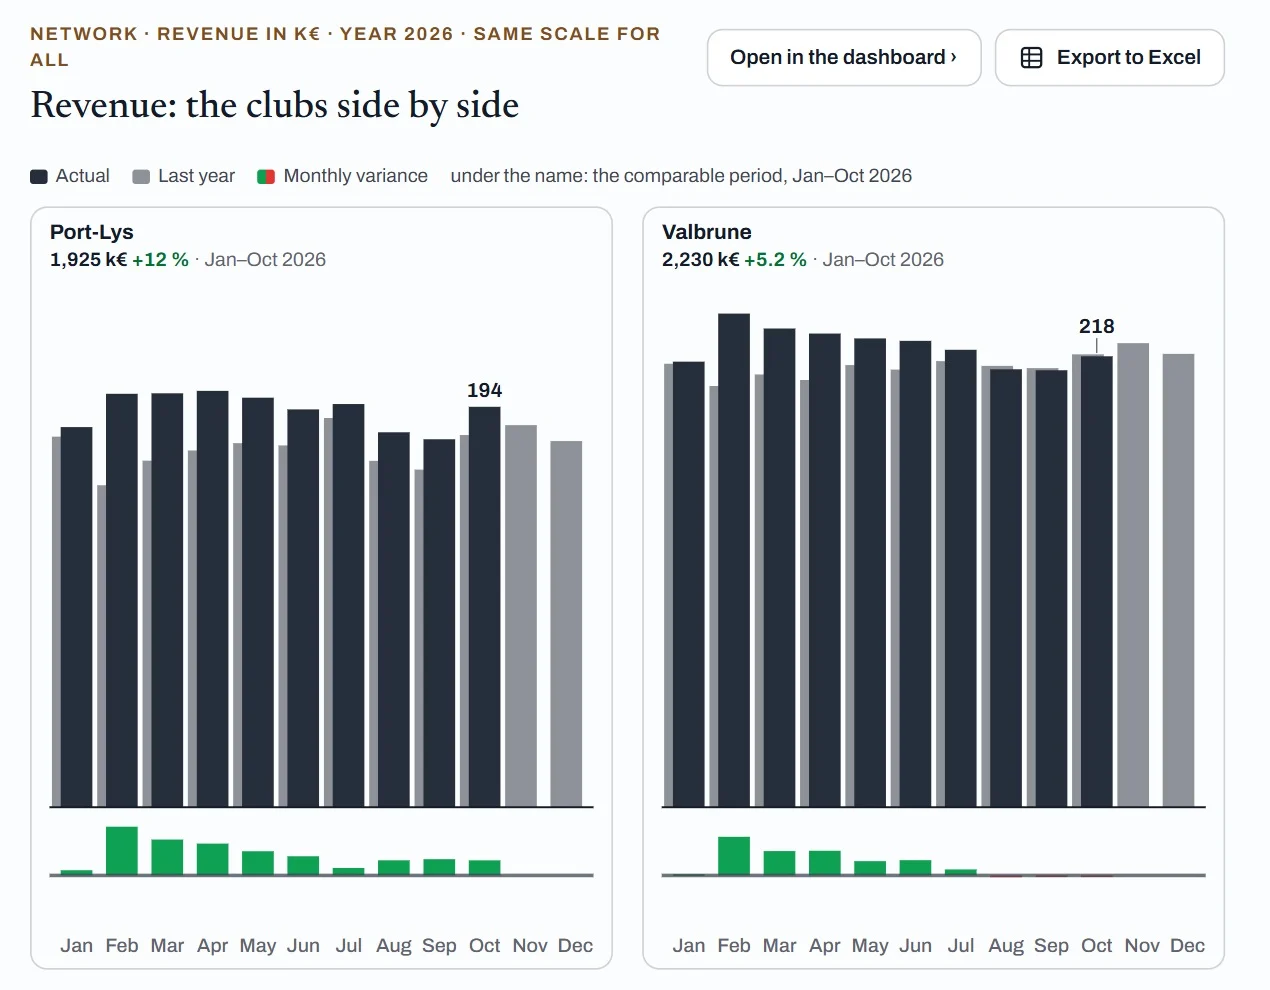
This year in dark, last year in grey, variances in red and green, on all twelve months. Waterfalls, bridges and variance bars a finance director reads at a glance.
KPI cards, monthly breakdown, variance table
Twelve months against last year
One notation on every page
Illustrative data — Elvane, a fictional company.
04 / 12 · Stats
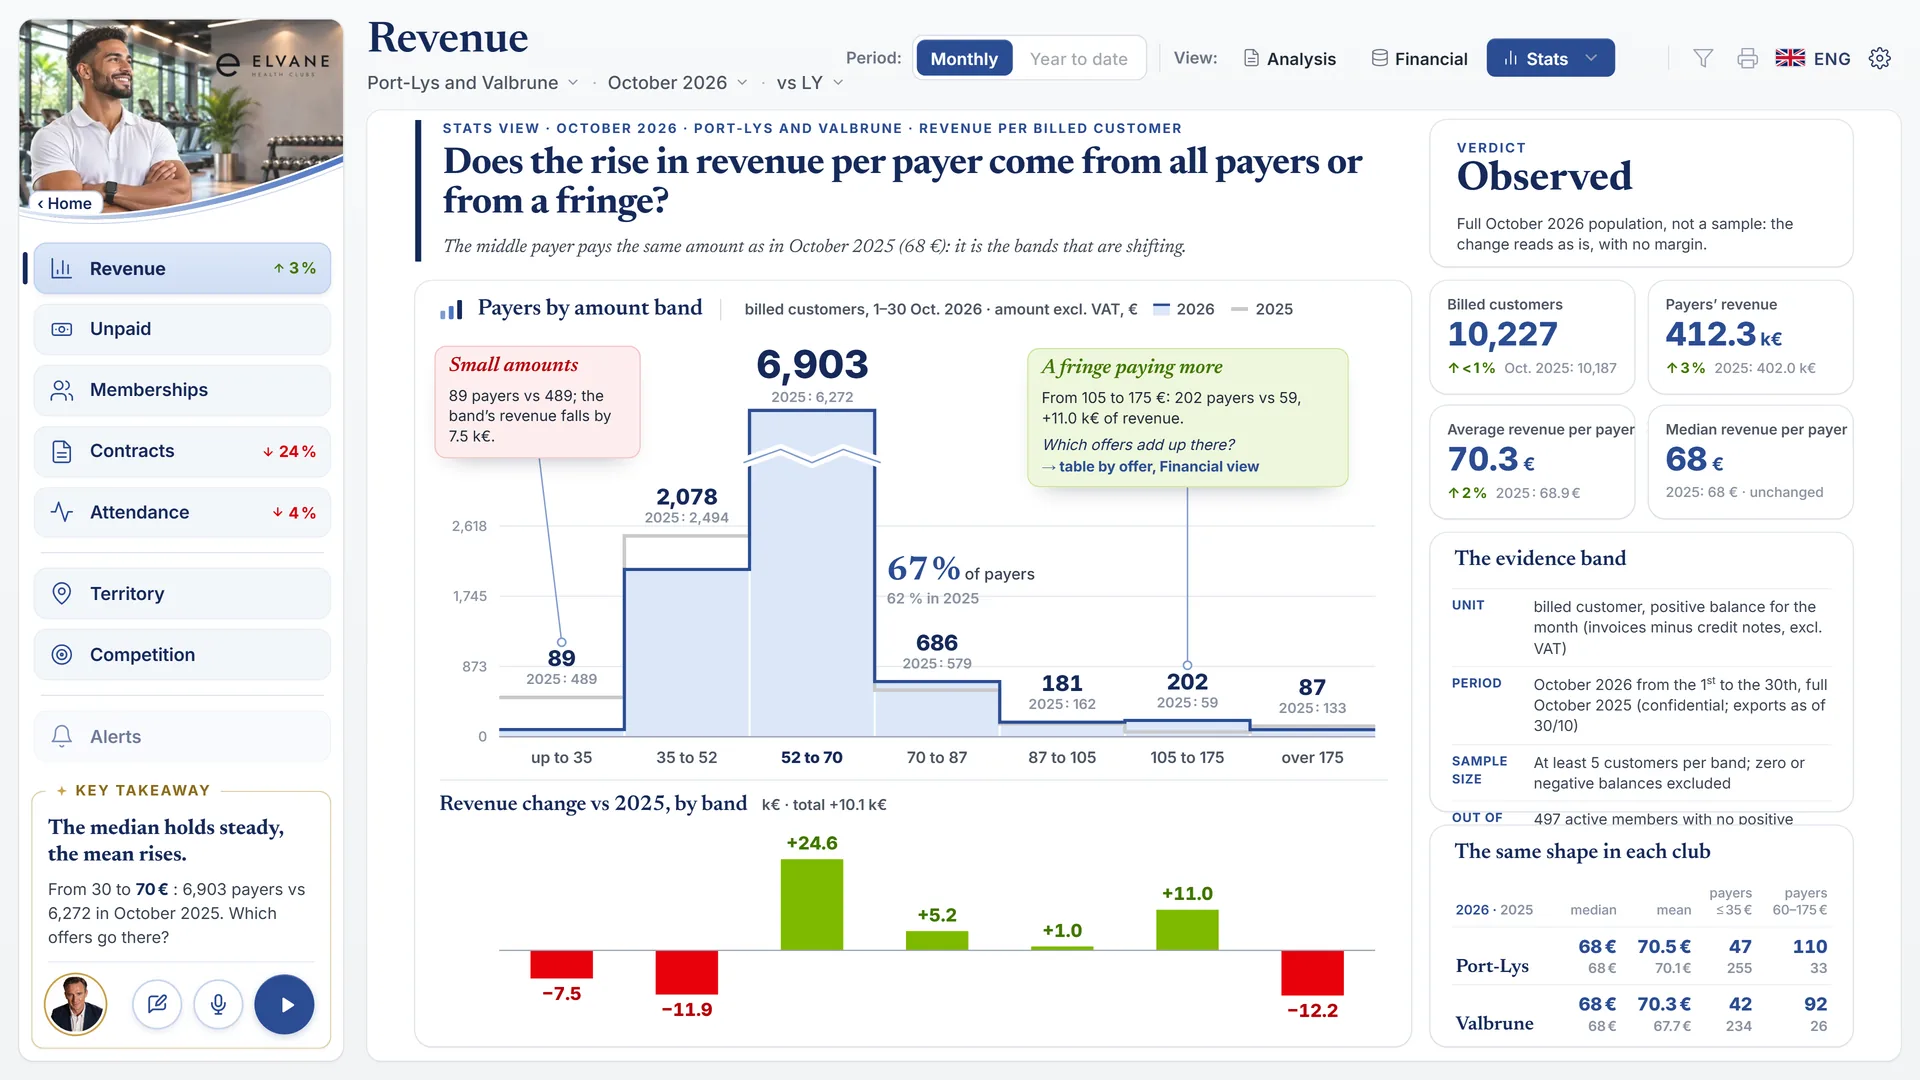
See who is behind the number.
The Stats view breaks the figure down by amount band, age or offer, and tells you how far the comparison can be trusted.
Like-for-like comparisons
A clear verdict on how far to trust the comparison
Statistical confidentiality built in
Illustrative data — Elvane, a fictional company.
Steps 05 to 09: the AI analyst
05 / 12 · Narrated review
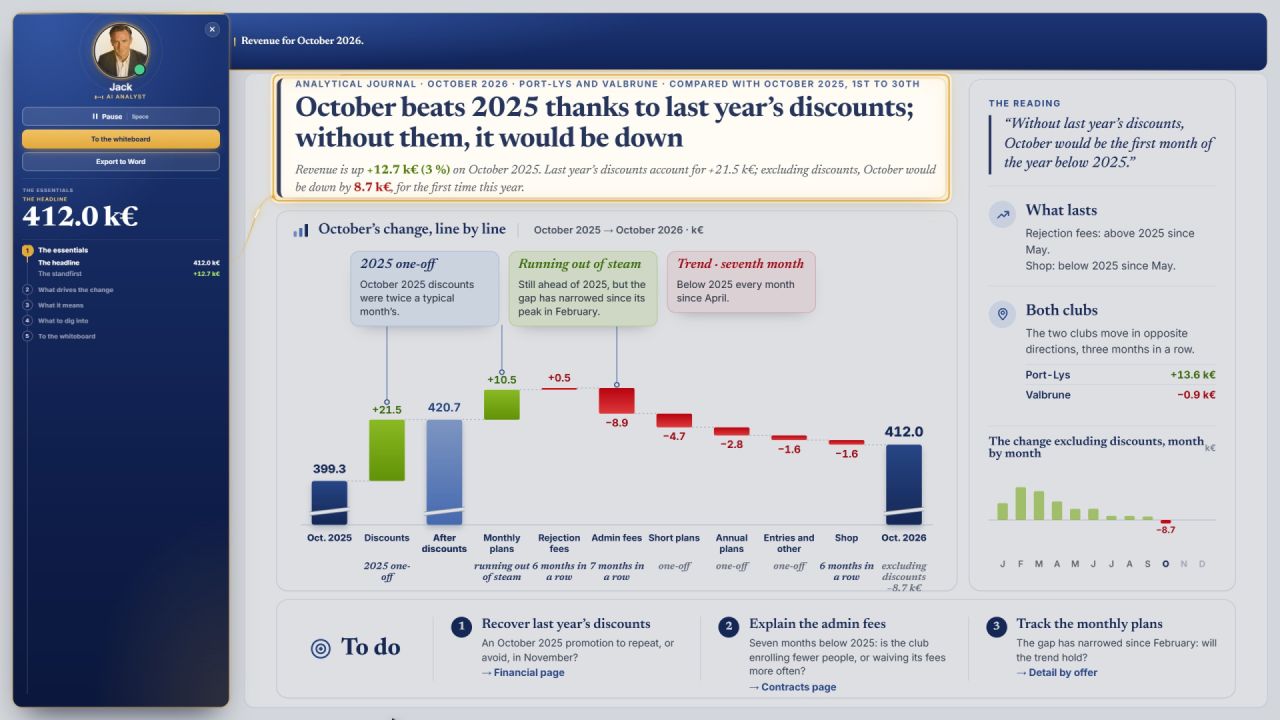
Your analyst takes the stage.
Press play on any page. The analyst takes over the screen, walks you through what it shows and highlights each element as it names it.
Highlights what it names
Subtitles on every sentence
Pause or interrupt at any time
Illustrative data — Elvane, a fictional company.
06 / 12 · Whiteboard
One idea, one drawing.
When an explanation needs a picture, the analyst puts it on a whiteboard while it speaks: one idea, one visual.
Built from your own figures
One idea per board
Explained aloud as it is drawn
Illustrative data — Elvane, a fictional company.
07 / 12 · Conversation
Ask out loud, in the meeting.
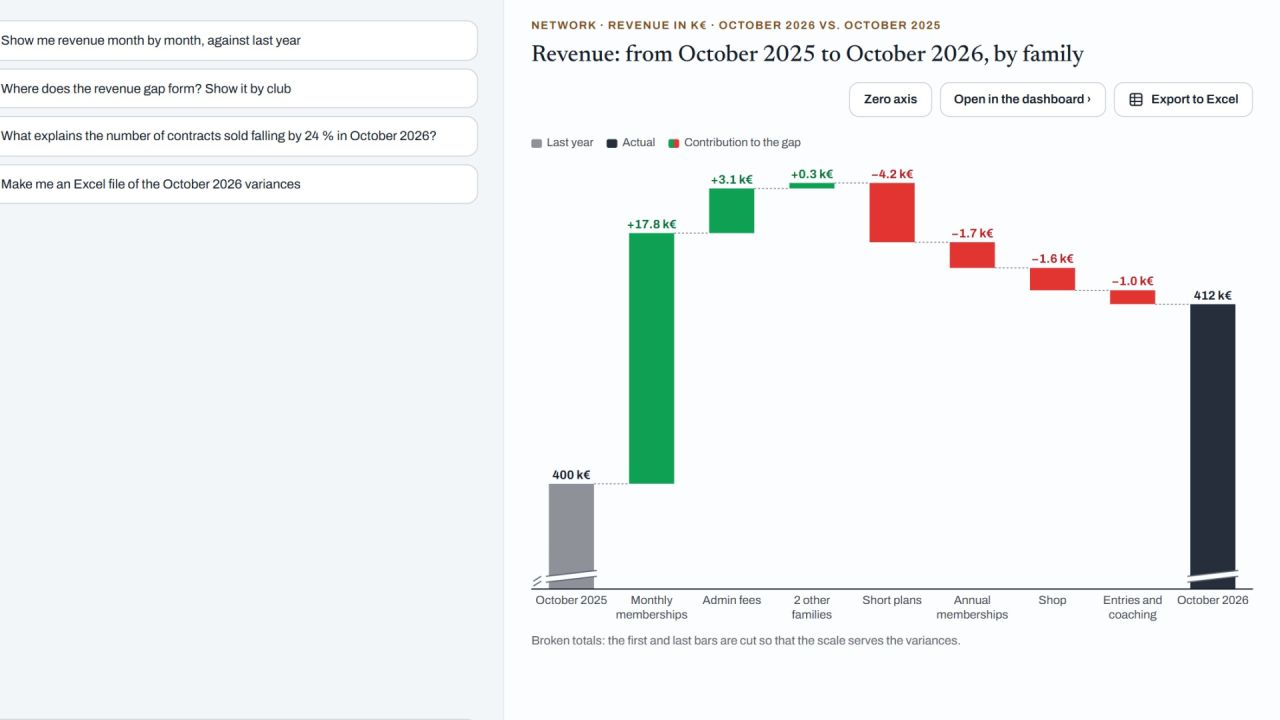
“Where does the revenue gap form?” The analyst answers aloud, puts the chart on screen and suggests the next question.
Written or spoken
Eleven languages
Interrupt, change the subject, carry on
Illustrative data — Elvane, a fictional company.
08 / 12 · Proof of a figure
Every figure shows its proof.
Hover overTap any number: formula, source, period and scope. Your rules are applied the same way on every page and in every answer.
Formula, source, period, scope
Your rules, the same everywhere
The engine calculates; the analyst explains
PROOF €412.0k
Formula
Σ revenue lines, net of credit notes
Source
Club management software
Period
October 2026
Scope
Port-Lys and Valbrune
Illustrative data — Elvane, a fictional company.
09 / 12 · Word and Excel
Leave the meeting with Word and Excel.
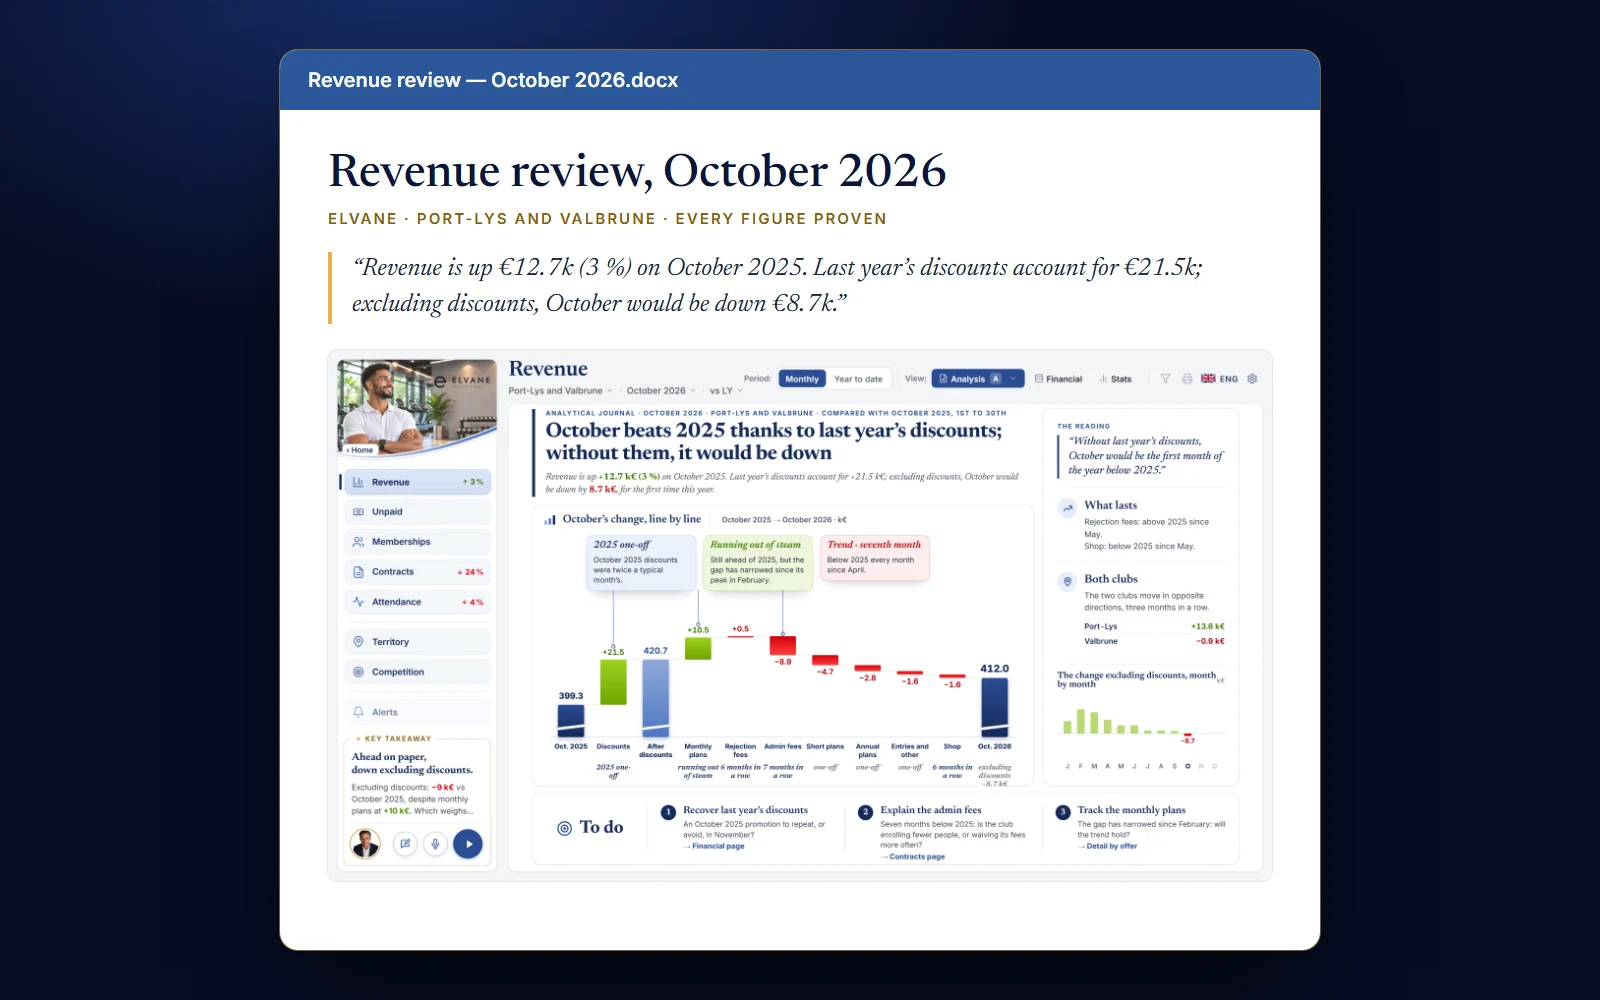
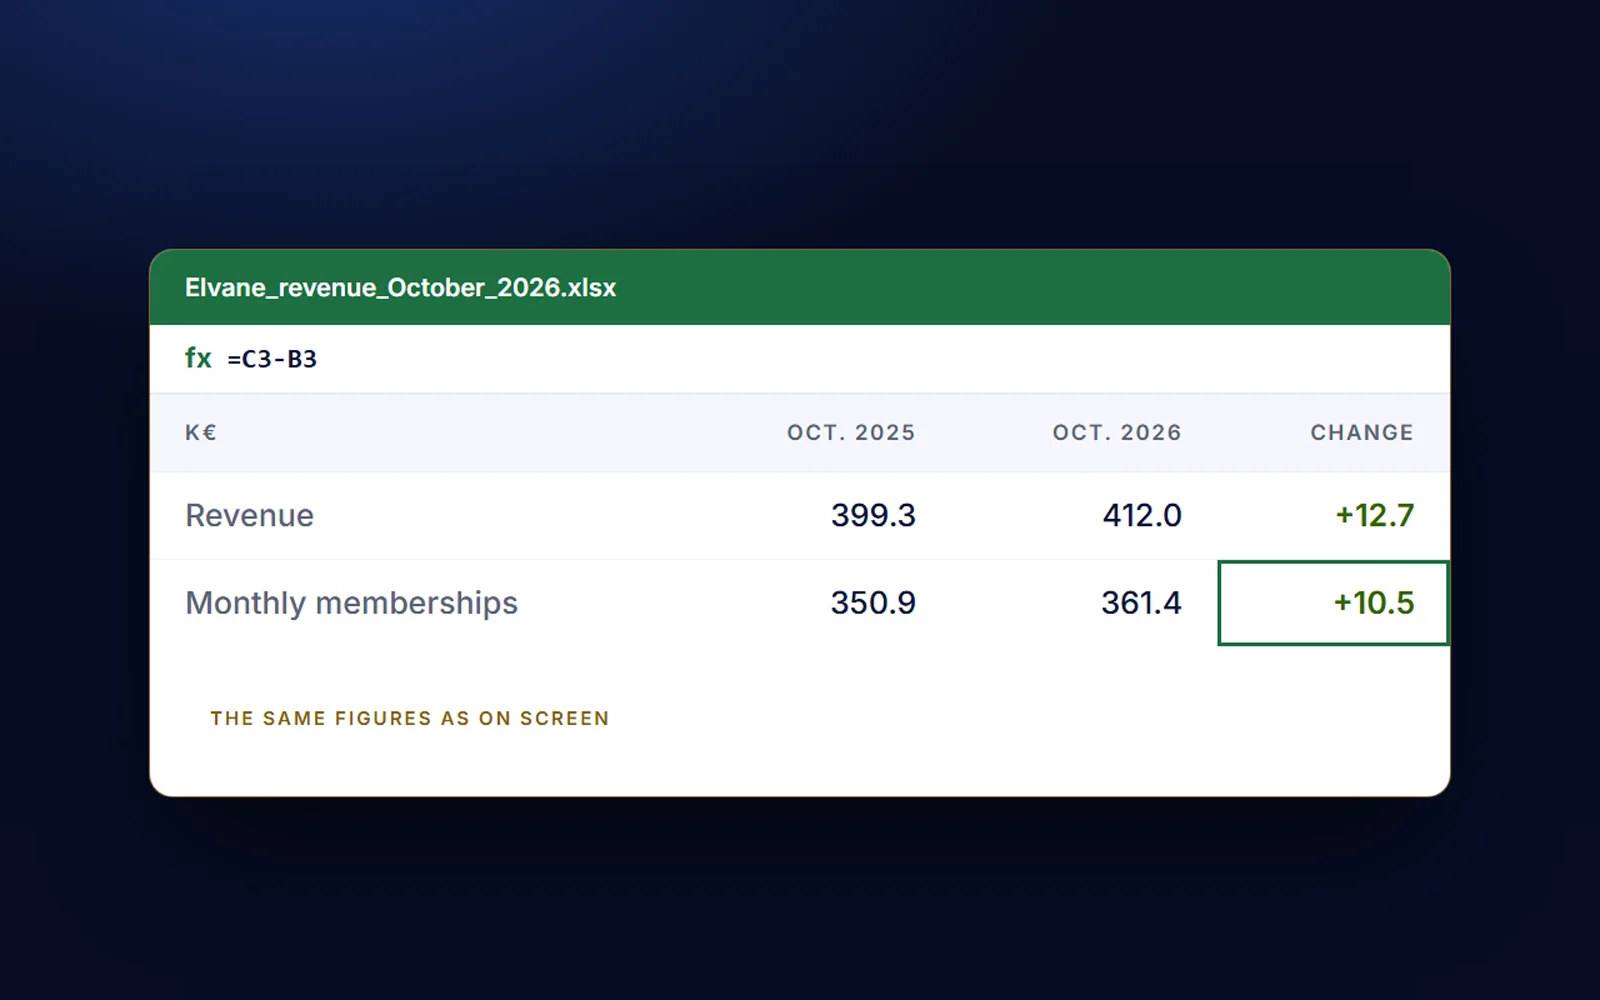
Export the conversation as a Word report with the analyst’s charts, and the figures as an Excel workbook with live formulas.
A Word report ready to circulate
Variances are formulas, not pasted values
The same figures as on screen
Illustrative data — Elvane, a fictional company.
Steps 10 to 12: automated reports, alerts and mobile
10 / 12 · Automated reports
Reports that send themselves.
Schedule PDF or Word packs and the review by email. Each reader receives it on the morning you choose.
Scheduled PDF and Word packs
The review by email
A morning review, every day
Illustrative data — Elvane, a fictional company.
11 / 12 · Alerts
Know when a threshold is crossed.
Set your thresholds. A push notification or an email tells you when a figure crosses one, how much it weighs and where to look.
Valbrune · rejected debits11.6 % of attempts in October, up 1.3 pt on last year.
Illustrative data — Elvane, a fictional company.
12 / 12 · Mobile
The same analyst, in your pocket.
Every page, every view and the analyst on desktop, tablet and phone — for everyone in the company.
Illustrative data — Elvane, a fictional company.
In every plan
And around the product.
Trust & Security
Names anonymized before any exchange with the AI model
Your rules, applied the same way everywhere
Hosted in Europe; dedicated hosting or your own servers, and single sign-on, on the Group plan
Access & platform
Unlimited users
Desktop, tablet and mobile
No Power BI, Zebra BI or other license
Resamania, Sage, Power BI datasets, SQL Server, your ERP, Excel and CSV files, business applications
Service
Set-up free when we already connect to your software
Email support in Club
A monthly review with DataVizX in Network and Group; a steering committee in Group
Academy training by a Qualiopi-certified training organization
Options: extra pages, more speaking hours, your own avatar (included in Group)